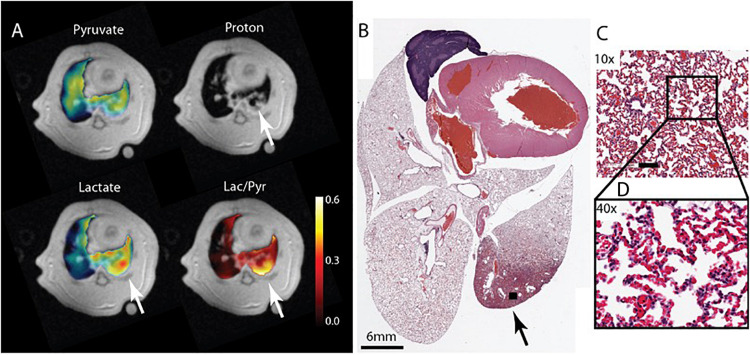
FIGURE 7.
(A) Pyruvate, lactate and lactate -to-pyruvate segmented maps overlaid on their corresponding proton image of a ZEEP rat 4 h after the acid instillation shows injury to the posterior right lung marked by increased intensity in the proton image (white arrow). The metabolite maps show increased lactate signal intensity and lactate-to-pyruvate ratio colocalized with the injured area. (B) Hematoxylin and Eosin (H&E) axial slide of the whole lung clearly shows damaged lung tissue in the same area (black arrow). Magnified images taken from the injured area (black box) with (C) 10× and (D) 40× magnifications show severe damage and inflammatory infiltrates in the tissue. The bar in (C) is 100 μm. Reproduced with permission from Pourfathi (2019).

