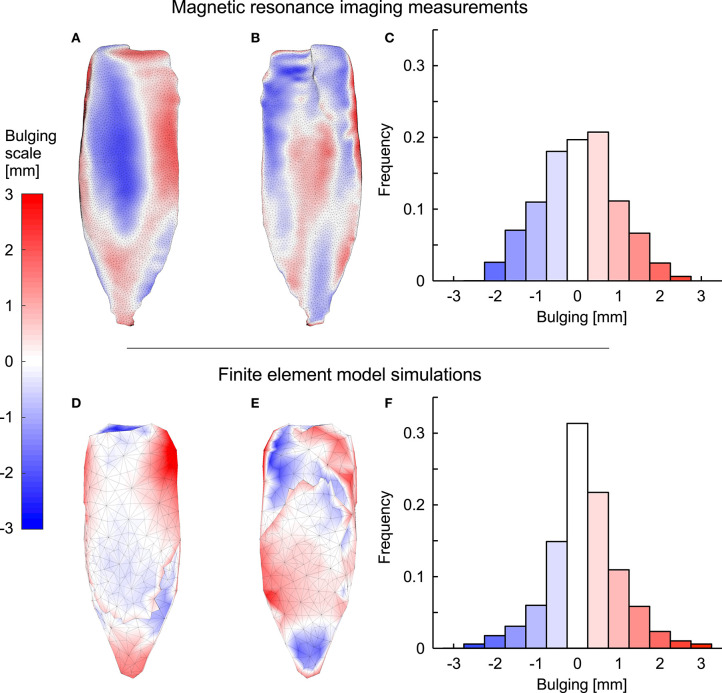
Figure 12.
Muscle bulging in the medial gastrocnemius during fixed-end contraction. (A–C) show MRI data and (D–F) show data predicted by the FEM model for the MRI-derived geometry for one subject where we set the initial muscle fibre orientation β0 to 25°. Red and blue shades indicate outwards and inwards bulging [in mm] at 20% activation, respectively. (A,D) show the superficial surface of the muscle whereas (B,E) show the deep surface. The proportions (frequency) of the points on both surfaces that showed different magnitudes and directions of bulging are shown in (C,F).

