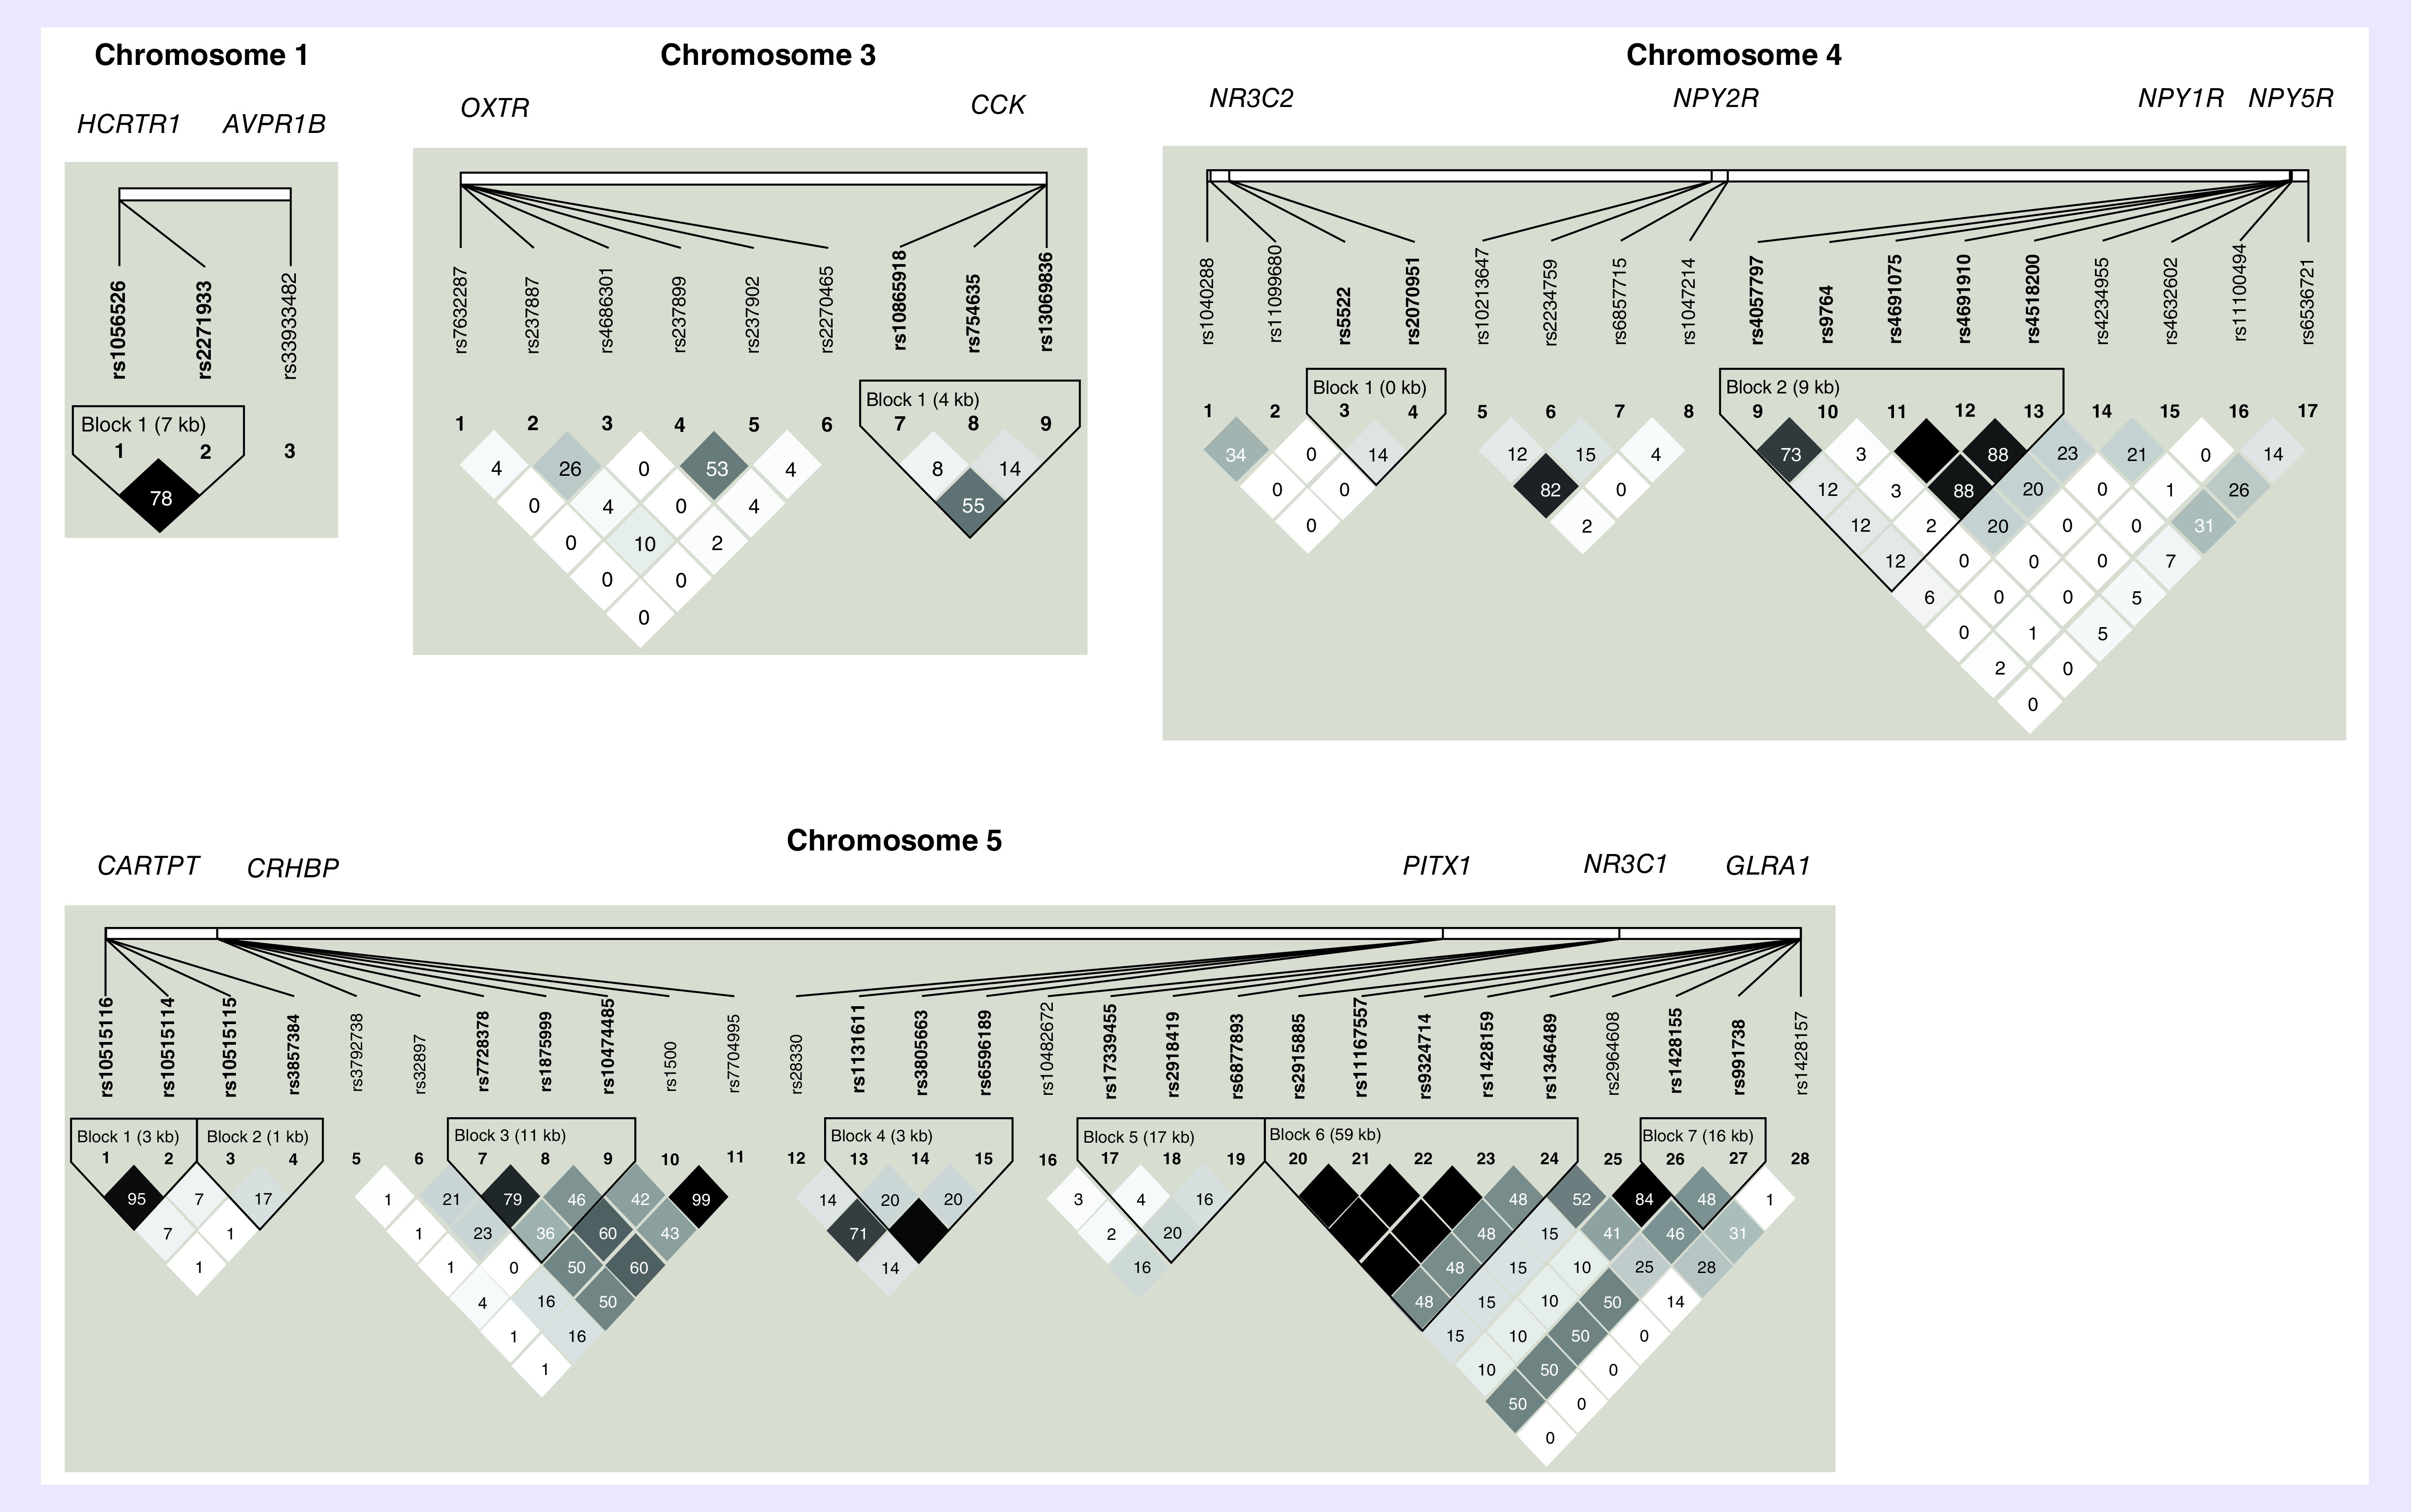
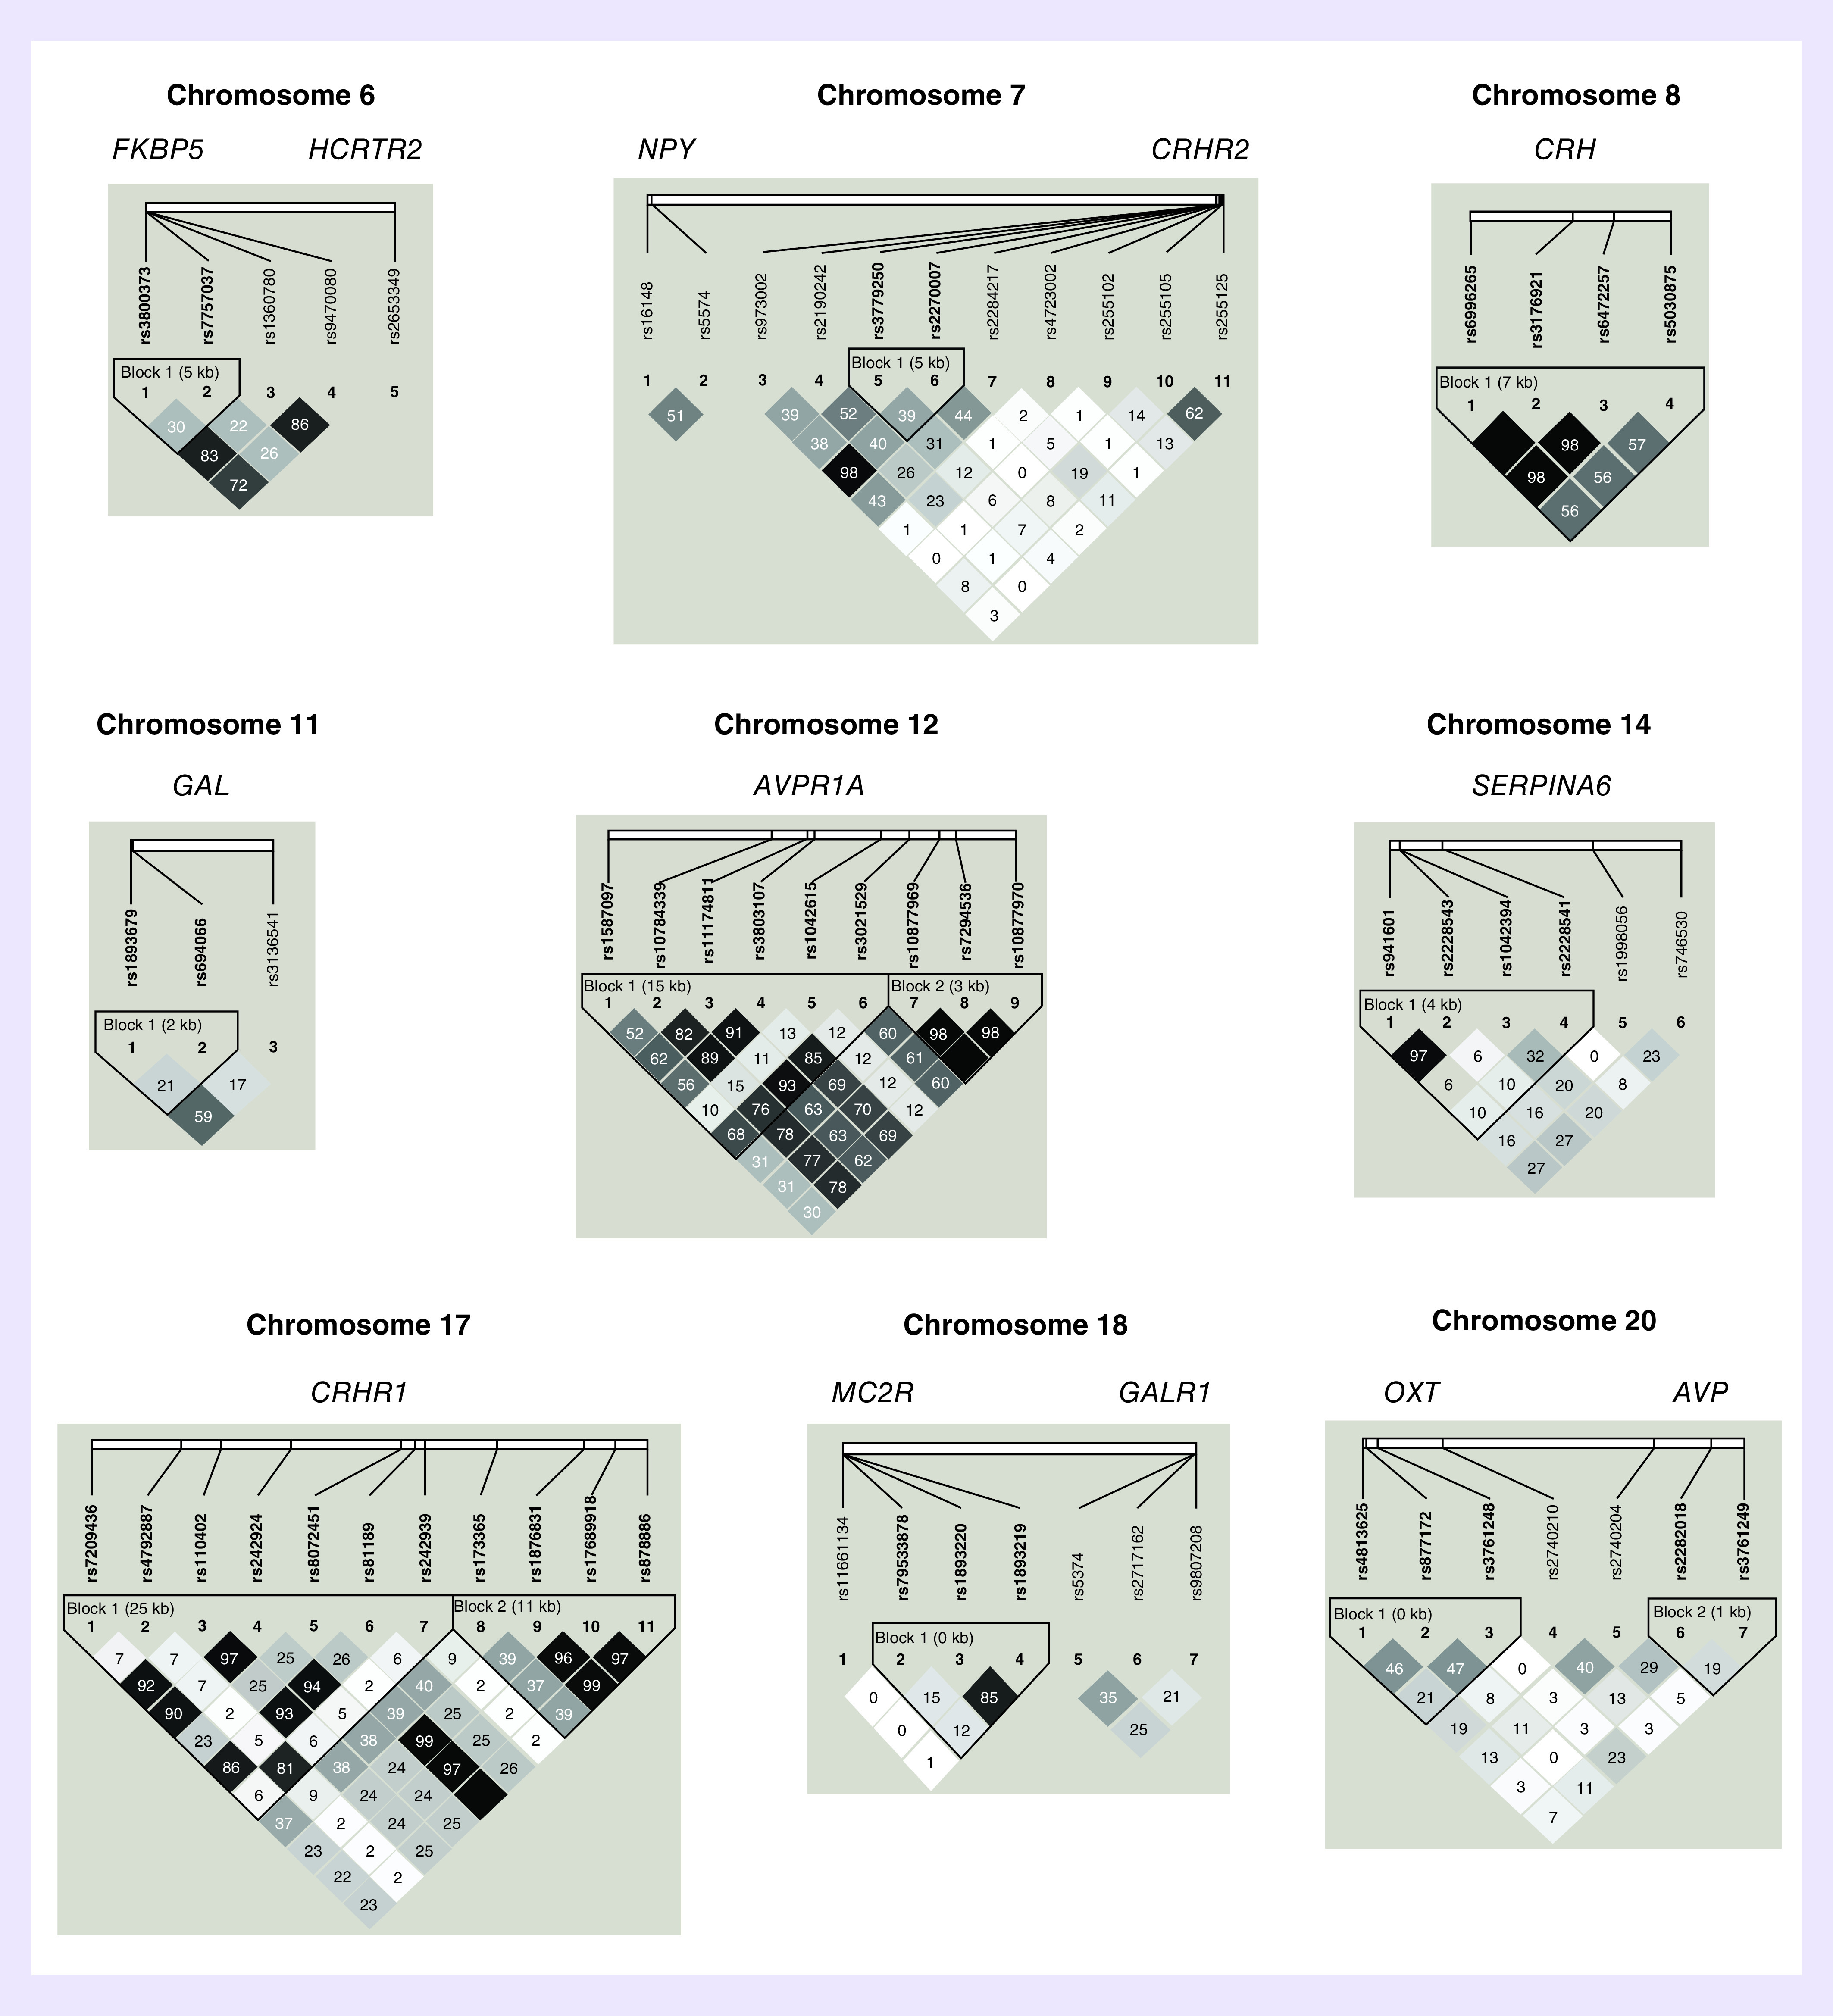
Figure 1. . Pairwise linkage disequilibrium.


The pairwise correlation between SNPs, measured in r2, calculated from the genotypes of the control subjects. The values shown are (100×) in each box. The magnitude of the value is indicated by the shade of color.
