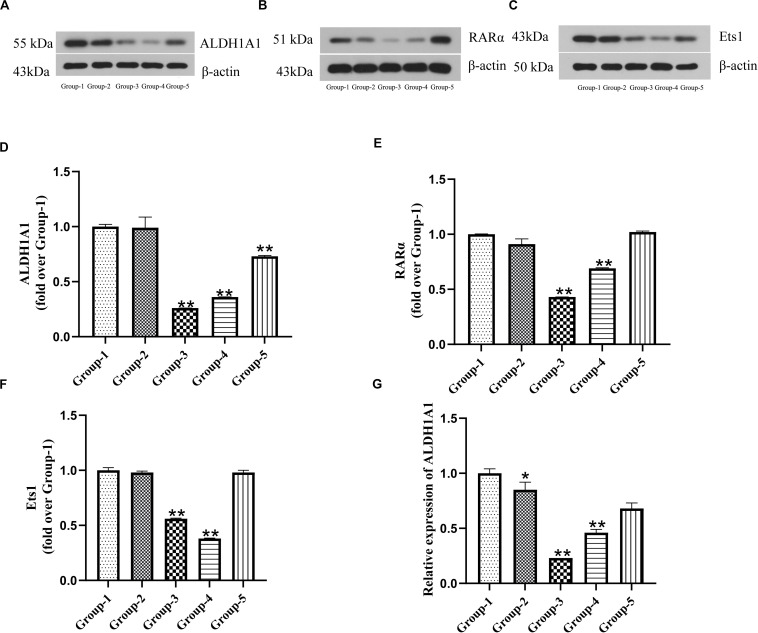
FIGURE 2.
The expression of ALDH1A1 and RARα as well as Ets1 were positive correlation in prostate cancer cells. Group-1 was Untreated group, Group-2 was Negative matched control transfection group, and Group-3, -4, -5 were Transfection group (Group 3–5 were transfected with siRNA-1, siRNA-2, siRNA-3). The expressions of ALDH1A1 (A), RARα (B), Ets1 (C) were detected by Western blotting, Statistical analysis on them (D–F). (G) Relative expression of ALDH1A1 mRNA was examined by RT-PCR. Data are expressed as the mean ± SD of three independent experiments. *P < 0.05 and **P < 0.01 compared with group-1.

