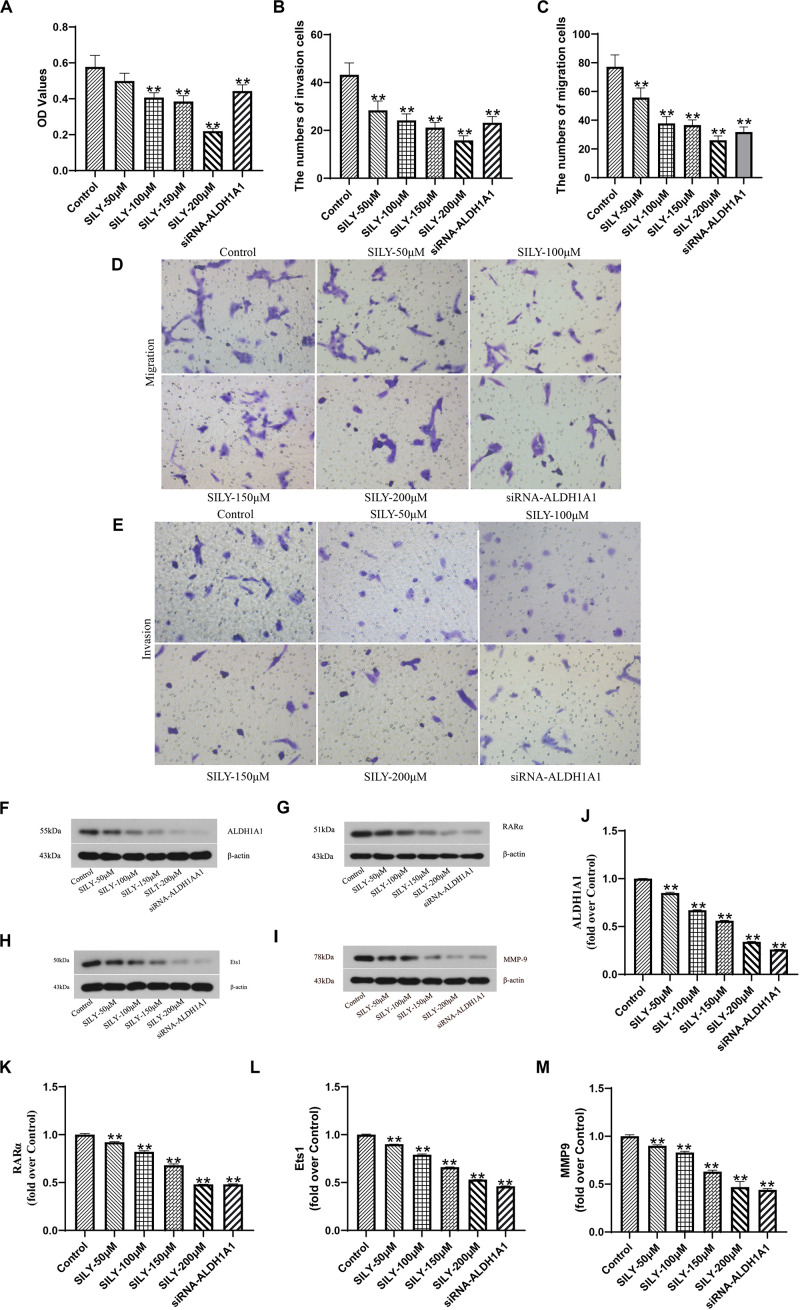
FIGURE 4.
Biological function of Silybin on DU145 cells. The cells proliferative capacity was assessed by MTT assay (A). The images of Transwell assay were recorded (D,E) which revealed the numbers of invasion (B) and migration (C) cells. The expressions of ALDH1A1 (F), RARα (G), Ets1 (H), MMP9 (I) were detected by Western blotting, Statistical analysis on them (J–M). Data are expressed as the mean ± SD of three independent experiments. *P < 0.05 and **P < 0.01 compared with Control group.

