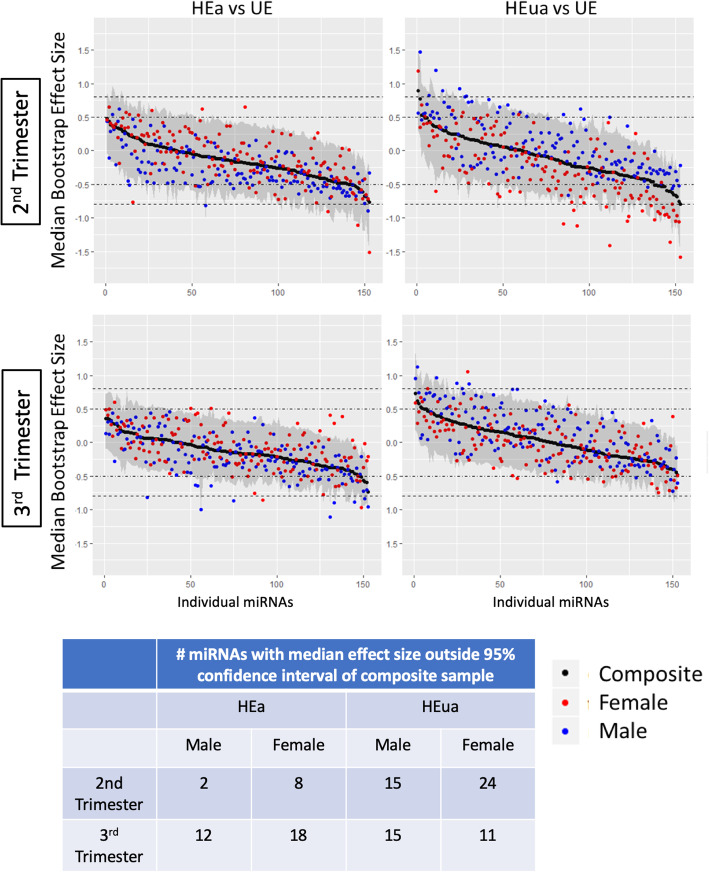
Fig. 2.
Bootstrap resampling to assess the stability of Hedges’ g effect size estimates. Median (black dots) and 95% confidence intervals (gray shading) of the bootstrapped effect sizes for each miRNA for the total sample at the second and third trimester time points. Separate bootstrap analysis of the median effect size of miRNA expression from pregnancies with female (red dots) or male (blue dots) fetuses is overlaid. miRNAs are arranged on the x-axis in the order of decreasing median bootstrap effect size in the composite analyses. Dotted lines indicate moderate (0.5) and large (0.8) effect size cutoffs. The table shows the number of miRNAs with sex-segregated median effect size falling outside the 95% confidence interval for the composite sample

