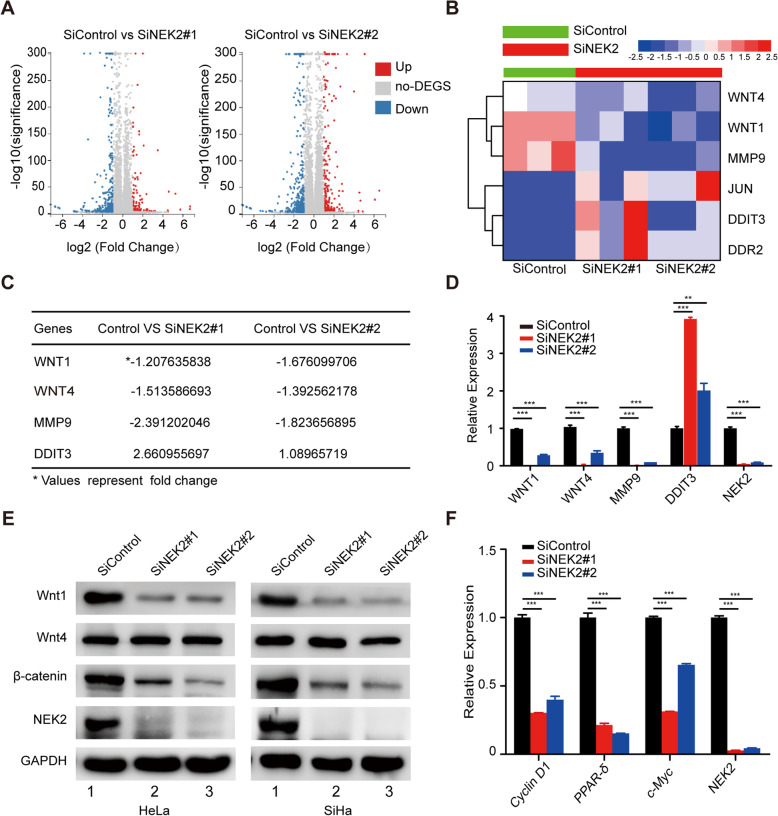
Fig. 5.
NEK2 silencing downreglates the expression of Wnt1 and attenuates the Wnt1/β-catenin signaling pathway. a Volcano plot of differentially expressed genes resulting from NEK2-depleted and control HeLa cells: the X-axis indicates the log2 transformed expression values, and the Y-axis represents the significance value after -log10 transformation. Red indicates upregulated differentially expressed genes, blue indicates downregulated differentially expressed genes, and gray indicates non-differentially expressed genes. b Heat map produced from RNA-seq data. HeLa cells were transfected with the indicated siRNAs for 48 h, and total mRNA was subjected to RNA-seq analysis. c List of several differentially expressed genes related to cell proliferation (Fold change > 2). d HeLa cells were transfected with the indicated siRNAs. After 48 h, the cells were harvested, and the levels of indicated mRNAs were measured by quantitative real-time PCR. ** P < 0.01, *** P < 0.001 (n = 3). e Knockdown of NEK2 led to decreased protein levels of Wnt1 and β-catenin in HeLa and SiHa cells (n = 3). f HeLa cells transfected with the indicated siRNAs for 48 h were collected, and the levels of indicated mRNAs were determined by quantitative real-time PCR. *** P < 0.001 (n = 3)

