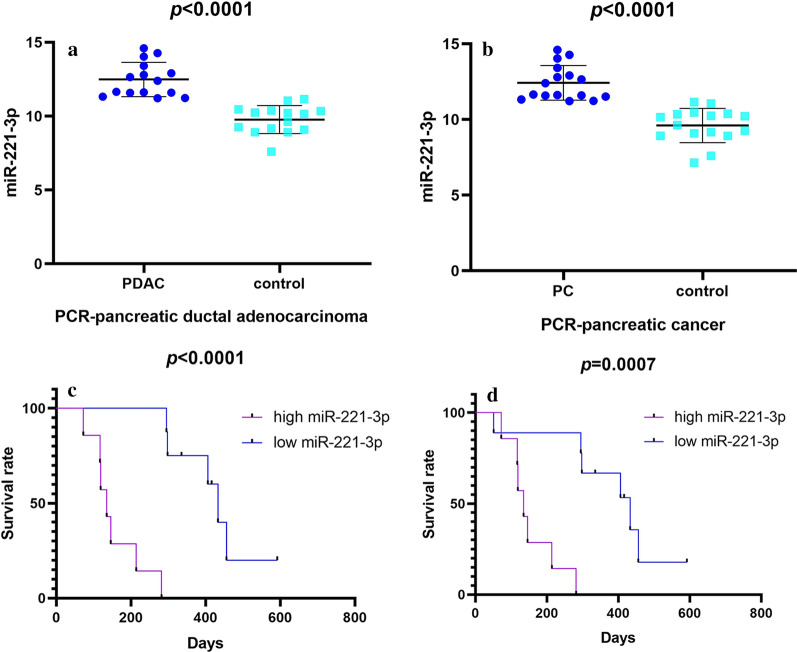
Fig. 5.
Data revealing miR-221-3p content in pancreatic cancer compared with control according to the results of RT-qPCR and Kaplan–Meier curves of miR-221-3p. Kaplan–Meier curves illustrate that patients with high miR-221-3p tended to exhibit a shorter average survival time. a RT-qPCR of 15 paired pancreatic ductal adenocarcinoma tissues. b RT-qPCR of 16 paired pancreatic cancer tissues. c Kaplan–Meier curves in pancreatic ductal adenocarcinoma. d Kaplan–Meier curves in pancreatic ductal adenocarcinoma (purple curve: high expression; blue curve: low expression)

