
Fig. 1.
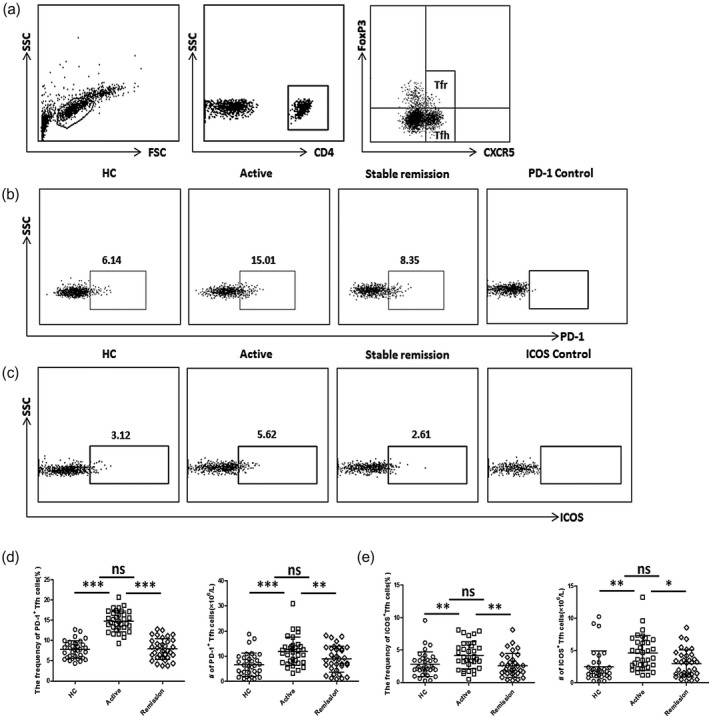
Flow cytometry analysis of inducible co‐stimulator (ICOS)+ follicular helper T cells (Tfh) and programmed cell death protein 1 (PD‐1)+ Tfh cells in ulcerative colitis (UC) patients. (a) Representative dot‐plots of Tfh and Tfr cells in CD4+CXCR5+T cells in peripheral blood mononuclear cells (PBMCs). CD4+CXCR5+forkhead box protein 3 (FoxP3)− cells were defined as Tfh and CD4+CXCR5+FoxP3+ cells were defined as Tfr cells. (b,c) Representative dot‐plots of peripheral PD‐1+ Tfh cells (b) or ICOS+ Tfh cells (c) in active UC patients, stable remission UC patients and healthy controls (HCs) are shown and the numbers indicate the corresponding percentages of each subset. Fluorescence minus one (FMO) scatter‐plots served as controls. (d,e) Comparison of peripheral PD‐1+ Tfh (d) or ICOS+ Tfh (d) cell percentages and absolute numbers (per liter) in active UC patients (n = 34), stable remission UC patients (n = 34) and healthy controls (n = 34). Data are shown as mean with standard deviation (s.d.). ***P < 0·001; **P < 0·01; *P < 0·05; n.s. = not significant.