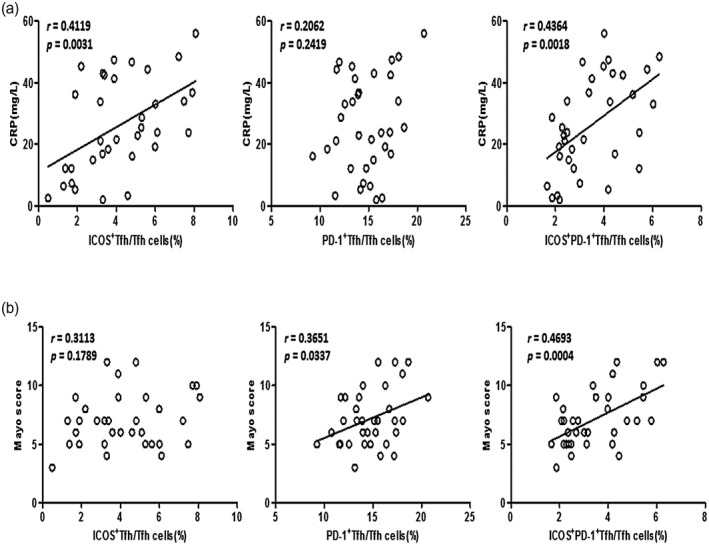
Fig. 4.

Correlation analyses between follicular helper T cells (Tfh) subpopulations and clinical indicators in active ulcerative colitis (UC) patients. Correlation analyses between inducible co‐stimulator (ICOS)+ Tfh, programmed cell death protein 1 (PD‐1)+ Tfh or ICOS+PD‐1+ Tfh percentages [within CD4+CXCR5+ forkhead box protein 3 (FoxP3)− Tfh] and serum C‐reactive protein (CRP) levels (above) or Mayo scores (below) were conducted using Spearman’s rank correlation test. Data are from 34 active UC patients and are shown as scatter‐plots. The r‐ and P‐values are listed. For P‐values less than 0·05, the graph is linearly fitted to show the trend.
