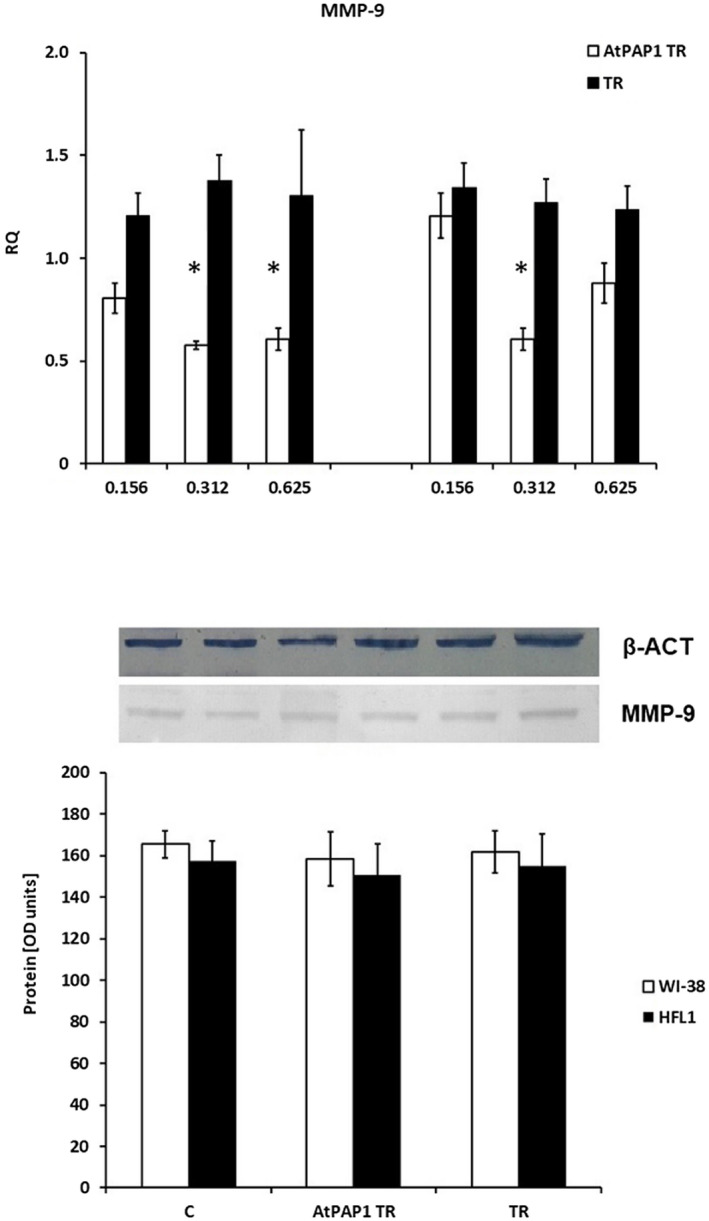
Fig. 3.

Expression of metalloproteinase 9 (MMP‐9) mRNA (a) and protein (b) in fibroblast cell lines. (a) mRNA expression presented as relative quantity (RQ) levels in Wistar Institute‐38 (WI‐38) (left panel) and human fetal lung fibroblasts (HFL1) (right panel) after exposure to three chosen concentrations of transcriptional factor over‐expression‐transformed (AtPAP1 TR) and Leonurus sibiricus‐transformed (TR) extracts. The results of quantitative polymerase chain reaction (qPCR) are presented as relative expression in relation to β‐actin. *P < 0·05. Data presented as RQ ± standard deviation (s.d.). (b) The results of immunoblotting are presented as % optical density (OD) over background values. Data are presented as mean ± s.d. after incubation with 0·312 mg/ml AtPAP1 TR and TR extracts.
