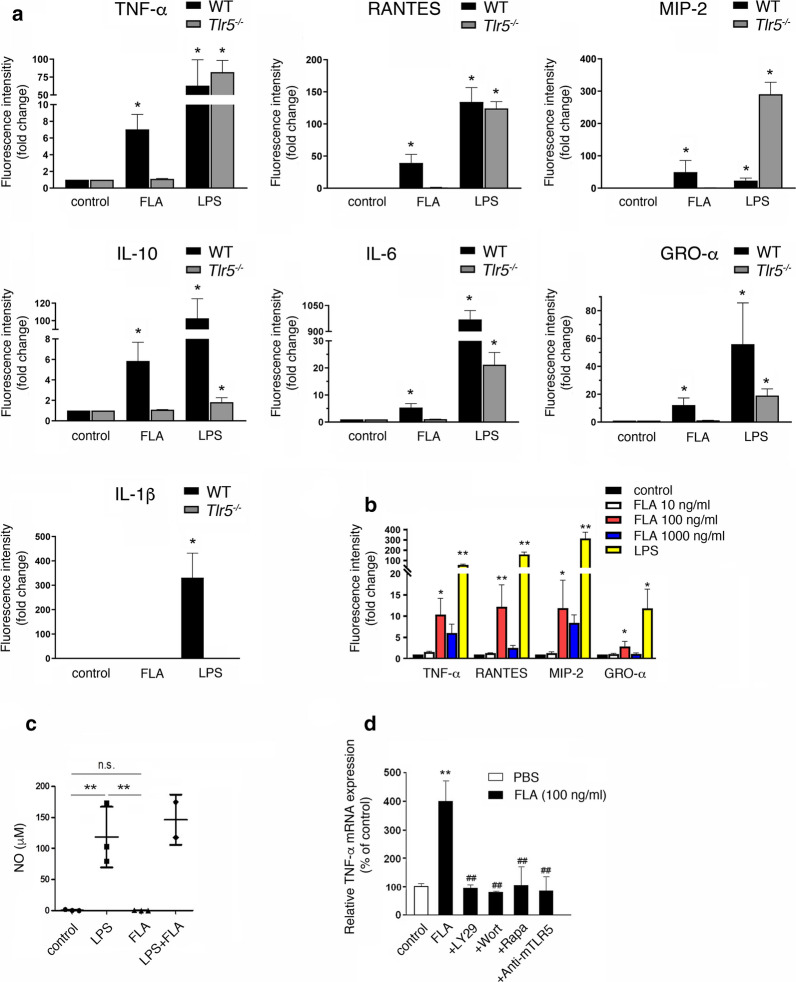
Fig. 2.
Flagellin induces the release of cytokines and chemokines from microglia through TLR5 signaling. a Multiplex immunoassay was used to detect cytokines/chemokines, as indicated, in supernatants of cultured neonatal microglia from C57BL/6 (WT) and Tlr5−/− mice in response to 100 ng/ml flagellin (FLA) after 24 h. Unstimulated cells served as negative control, while LPS (100 ng/ml) was used as positive control (n = 3). b Supernatants of cultured neonatal WT microglia stimulated with 10 ng/ml, 100 ng/ml, 1000 ng/ml FLA, or 100 ng/ml LPS were analyzed for indicated cytokines/chemokines after 24 h by multiplex immunoassay. Unstimulated cells served as control (n = 3). Results are expressed as mean ± SEM. Data were analyzed by Kruskal–Wallis test followed by Dunn’s post hoc test. *P < 0.05; **P < 0.01 vs. control. c Cultured neonatal WT microglia were stimulated with 100 ng/ml FLA and/or 100 ng/ml LPS for 24 h, and supernatants were analyzed for NO using Griess assay (n = 3). Results are expressed as mean ± SEM. Data were analyzed by Kruskal–Wallis test followed by Dunn’s post hoc test. **P < 0.01 vs. control; n.s., not significant. d WT microglia were incubated with 100 ng/ml FLA alone or in combination with LY294002 (50 μM), Wortmannin (1 μM), rapamycin (100 μM), or anti-mTLR5-IgG (1 μg/ml) for 6 h. DMSO-containing DMEM served as control, while FLA was solved in DMSO-containing DMEM. Subsequently, quantitative RT-PCR using primers against TNF-α was performed. TBP served as housekeeping gene (n = 5). Results are expressed as normalized to control and are represented as mean ± SD. Data were analyzed by one-way ANOVA followed by Tukey’s post hoc test. **P < 0.01 vs. control; ##P < 0.01 vs. FLA

