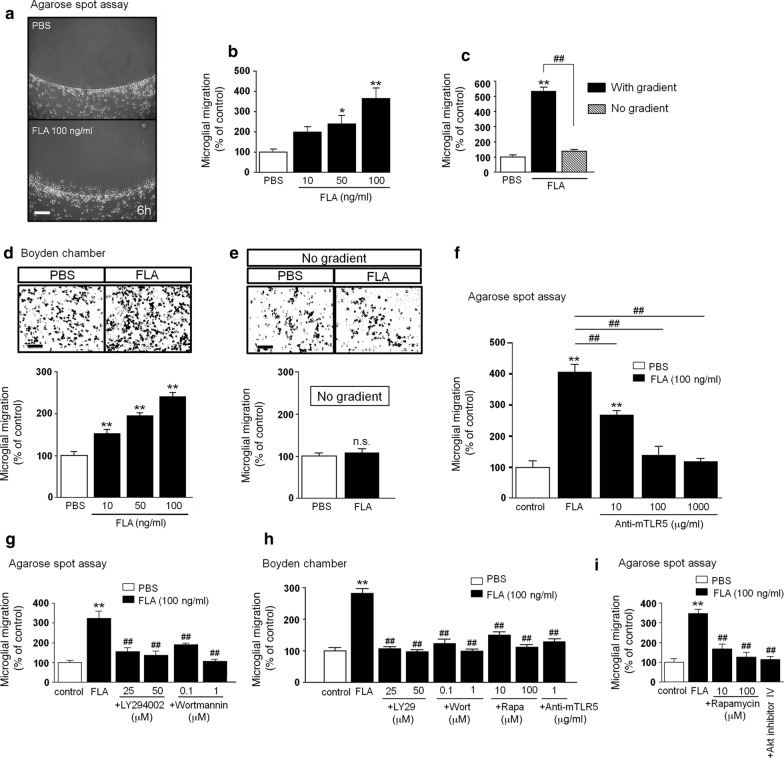
Fig. 3.
Flagellin triggers chemotaxis, but not random motility in microglia, through TLR5 and PI3K/PDK1/Akt/mTORC1 signaling. a–c Microglial migration in response to flagellin (FLA) was analyzed by agarose spot assay. a Images of FLA- and PBS (control)-treated C57BL/6 microglia. Scale bar, 100 μm. b Various FLA doses, as indicated, were added either to the spot alone (gradient/black, n = 8) or c to both the spot and the culture medium (no gradient/grey, n = 4). PBS was used as negative control. Microglial migration was quantified after 6 h of FLA incubation. Results are expressed as mean ± SEM. Data were analyzed by one-way ANOVA followed by Tukey’s post hoc test. *P < 0.05; **P < 0.01 vs. control; ##P < 0.01. d Microglial migration in response to FLA was analyzed by Boyden chamber assay. Images of C57BL/6 microglia plated in the upper compartment and treated with 100 ng/ml FLA. PBS served as control. Scale bar, 100 μm (upper panel). Microglial migration in response to various FLA doses, as indicated, was quantified after 6 h (lower panel, n = 10). Results are expressed as mean ± SEM. Data were analyzed by one-way ANOVA followed by Dunnett’s post hoc test. **P < 0.01 vs. control. e Quantification of microglia plated in both wells of the Boyden chamber lacking a gradient (n = 10). Results are expressed as mean ± SEM. Data were analyzed by one-way ANOVA followed by Dunnett’s post hoc test. n.s., not significant. f Agarose spot assay testing microglial migration, as described in (a, b) in the presence of various doses of mouse TLR5-neutralizing antibody (anti-mTLR5), as indicated (n = 4). Results are expressed as mean ± SEM. Data were analyzed by one-way ANOVA followed by Dunnett’s post hoc test. **P < 0.01 vs. control; ##P < 0.01. g Agarose spot assay testing microglial migration, as described in (a, b) in the presence of LY294002 (25 and 50 μM) and Wortmannin (0.1 and 1 μM), n = 12. Results are expressed as mean ± SEM. Data were analyzed by one-way ANOVA followed by Tukey’s post hoc test. **P < 0.01 vs. control; ##P < 0.01 vs. FLA. h FLA-induced (100 ng/ml) microglial migration in the Boyden chamber in the presence of LY294002 (25 and 50 μM), Wortmannin (0.1 and 1 μM), rapamycin (10 and 100 μM), or anti-mTLR5-IgG (1 μg/ml), n = 12. Results are expressed as mean ± SEM. Data were analyzed by one-way ANOVA followed by Tukey’s post hoc test. **P < 0.01 vs. control; ##P < 0.01 vs. FLA. (i) FLA-induced (100 ng/ml) microglial migration tested by agarose spot assay in the presence of rapamycin (10 and 100 μM) or Akt inhibitor IV (1 μM), n = 4. Results are expressed as mean ± SEM. Data were analyzed by one-way ANOVA followed by Tukey’s post hoc test. **P < 0.01 vs. control; ##P < 0.01 vs. FLA. g–i DMSO-containing DMEM served as control, while FLA was solved in DMSO-containing DMEM

