Fig. 5.
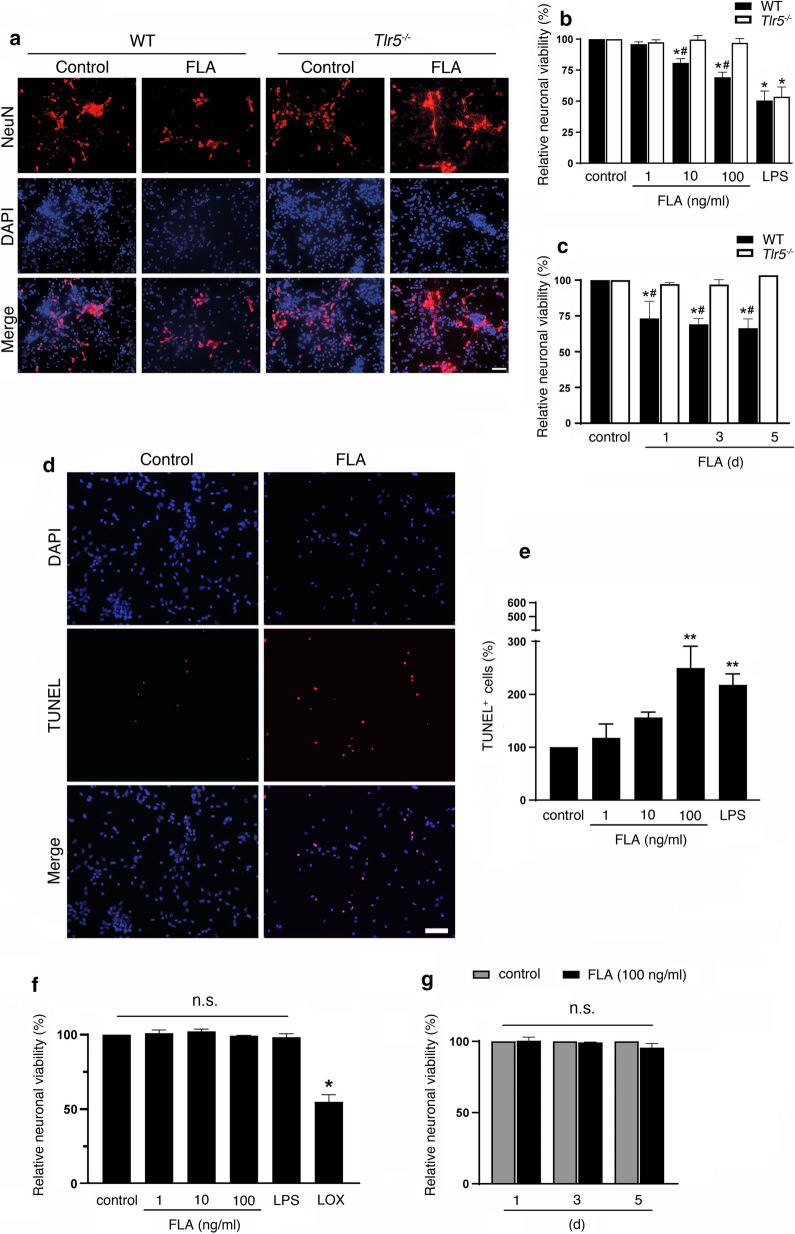
Flagellin induces neuronal cell death through TLR5 in vitro. a Co-cultures of C57BL/6 (WT) neurons and WT or Tlr5−/− microglia were incubated with 100 ng/ml flagellin (FLA) for 72 h. Subsequently, cells were stained with NeuN antibody to mark neurons, and DAPI to label nuclei, and representative images are shown (scale bar, 50 μm; n = 3). b, c NeuN-positive cells in co-cultures treated with different FLA doses, as indicated, for 72 h (b), or with 100 ng/ml FLA for different time periods, as indicated (c), were quantified, and results were expressed as relative neuronal viability by setting the viability of control cells to 100%. 1 μg/ml LPS served as positive control, whereas unstimulated condition served as negative control (n = 3). d Images of TUNEL-positive and DAPI-labeled nuclei in unstimulated (control) and FLA-treated co-cultures containing WT microglia are shown (scale bar, 50 μm; n = 4). e Quantification of TUNEL-positive cells in co-cultures incubated with different FLA doses, as indicated, and with LPS, serving as positive control, relative to control (n = 4). Data are expressed as mean ± SEM. Results were analyzed by Kruskal–Wallis test followed by Dunn’s post hoc test. *P < 0.05; **P < 0.01 vs. control; #P < 0.01 vs. Tlr5−/−. f, g Purified neurons from C57BL/6 mice were incubated with various FLA doses, as indicated, 1 μg/ml LPS, or 1 mM loxoribine (LOX) for 72 h (f), or were incubated with 100 ng/ml FLA for indicated durations (g, n = 3). Subsequently, cells were stained with NeuN antibody and DAPI. NeuN-positive cells were quantified, and results were expressed as relative neuronal viability by setting the viability of control cells to 100%. Data are expressed as mean ± SEM. Results were analyzed by Kruskal–Wallis test followed by Dunn’s post hoc test. *P < 0.05 vs. control; n.s., not significant

