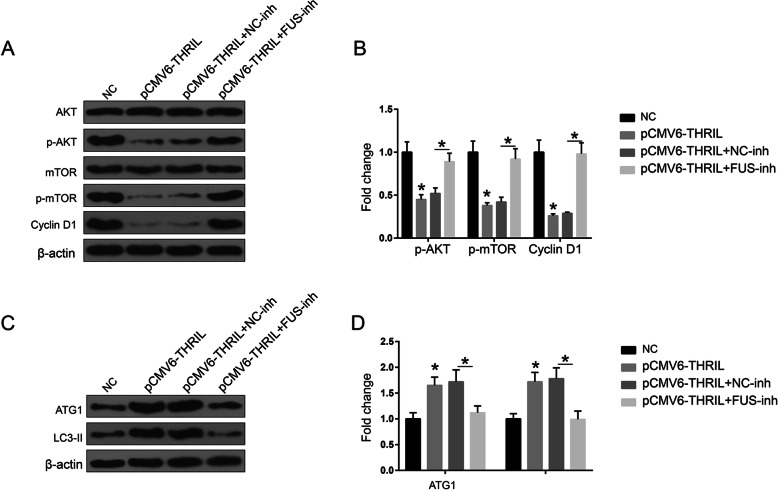
Fig. 4.
The effects of THRIL on AKT pathway and autophagy pathway were reversed through knockdown of FUS. (a) and (b) AKT signaling pathway expressions in various transfection groups. (c) and (d) ATG1 and LC3-II expression levels in various transfection groups. NC: EPCs isolated from CAD patients; All the transfection experiments were performed in EPCs isolated from CAD patients. *P < 0.05, compared with NC group. The data shown represent three separate experiments performed in triplicate in each experiment (mean ± the standard deviation [SD])

