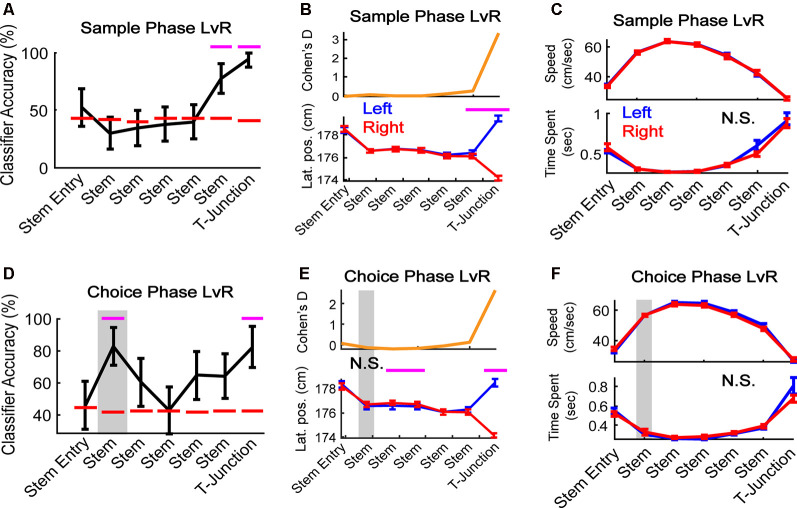
Figure 3.
mPFC population activity predicts a future decision. (A) During sample traversals, the mPFC population predicted trajectory (left vs. right turns) as rats approached and occupied T-junction (bin 6: Z = 2.0, p = 0.049; bin 7: Z = 2.9, p = 0.004). N = 187 neurons, six random trials were selected per class and neuron (see “Materials and Methods” section), 1,000 times. (B) Rats altered their lateral positions in a manner consistent with classification in panel (A). There was a significant interaction between task phase and bin (F(1,6) = 39.63, p = 1.3e-40). Bins 6 and 7 survived Bonferroni correction (t(43) = 3.4, p = 0.001; t(43) = 31.3, p = 3.3e-31; Bonferroni corrected alpha = 0.007). N = 44 sessions. (C) Differences in time-spent at the T-junction and velocity do not account for the mPFC predicting the future trajectory. There was no main effect of trajectory (F(1,6) = 0.08, p = 0.77) or interaction between sample left/right velocity and bin-location (F(1,6) = 0.05, p = 0.99). N.S. indicates no significance. (D) During choice phase, the mPFC predicted the future (Stem bin 2: Z = 2.28, p = 0.023) and current (T-junction: Z = 2.2, p = 0.028) trajectory. For classification procedures: N = 187 neurons, six random trials were selected per class and neuron, 1,000 times. Magenta lines indicate p < 0.05 using a z-test against a shuffled distribution. Gray box highlights the second bin where the mPFC could predict the future left or right, and is used in the following panels. Data are represented as the mean ± standard deviation. (E) Lateral positions do not change in the stem location where the population predicts a future decision in panel (D). There was a significant interaction between choice trajectory and stem bin (F(1,6) = 27.6, p = 3.8e-29). Stem bins 3 and 4, and T-junction, survived Bonferroni correction (t(43) = −4.3, p = 0.0001, t(43) = −3.5, p = 0.001, t(43) = 24.1, p = 1.2e-26; Bonferroni corrected alpha = 0.007). (F) There was no main effect of task phase nor interaction for choice left vs. choice right for velocity (top panel F(1,6) = 1.25, p = 0.26; F(1,6) = 0.97, p = 0.45) or time spent (bottom panel F(1,6) = 0.45, p = 0.5; F(1,6) = 1.86, p = 0.085. Gray box highlights the bin where classification accuracy was above chance. For behavioral analyses, data are represented as the mean ± SEM. Paired t-tests were performed, but only those that survived Bonferroni correction were plotted with magenta lines. N.S., not significant.

