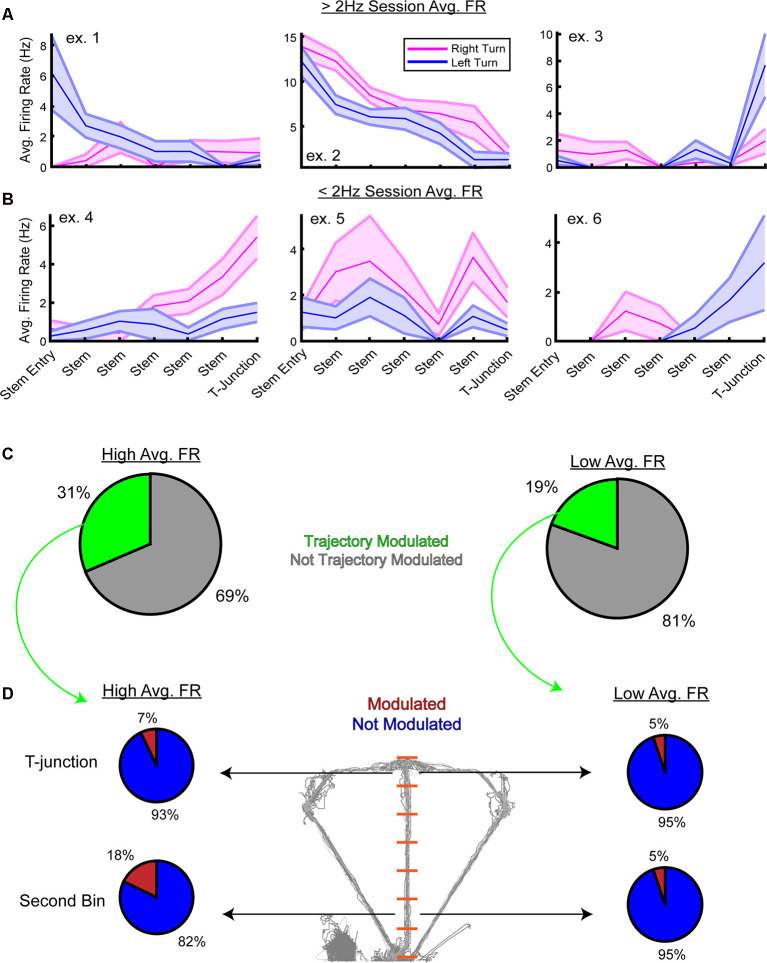
Figure 6.
Trajectory modulation is evident at the single-unit level from the high and low-rate populations. (A) Three example units from the high-rate population that were significantly modulated by trajectory on the stem of the DNMP task. Using a two-way analysis of variance, a unit was considered “significantly modulated” if there was a significant main effect of trajectory or a significant interaction between stem bin and trajectory on firing rates. Data are displayed as the trial-averaged mean ± SEM of firing rates. (B) Three example units from the low-rate population that were significantly modulated by trajectory. Note that while units exhibited a session average of <2 Hz, their firing rates on the stem can be above 2 Hz. (C) Pie charts from the high-rate population (left panel) and low-rate population (right panel) demonstrating the proportion of units modulated by trajectory. Note the greater percentage of high-rate neurons that are trajectory-modulated. (D) Follow up paired t-tests were performed on firing rates from the T-junction and the second stem bin. Alpha level was corrected using Bonferroni’s method (alpha = 0.025) and only units that had a p-value less than the corrected alpha level were included. Notice in the high-rate population, 18% of units were significantly modulated during early stem running, and 7% were modulated at T-junction. This is in contrast to the low-rate population where only 5% of the trajectory-modulated units exhibited preferential firing towards one trajectory at the second stem bin and T-junction. Note that the second stem bin is the first bin where the rat is completely enclosed by stem walls.

