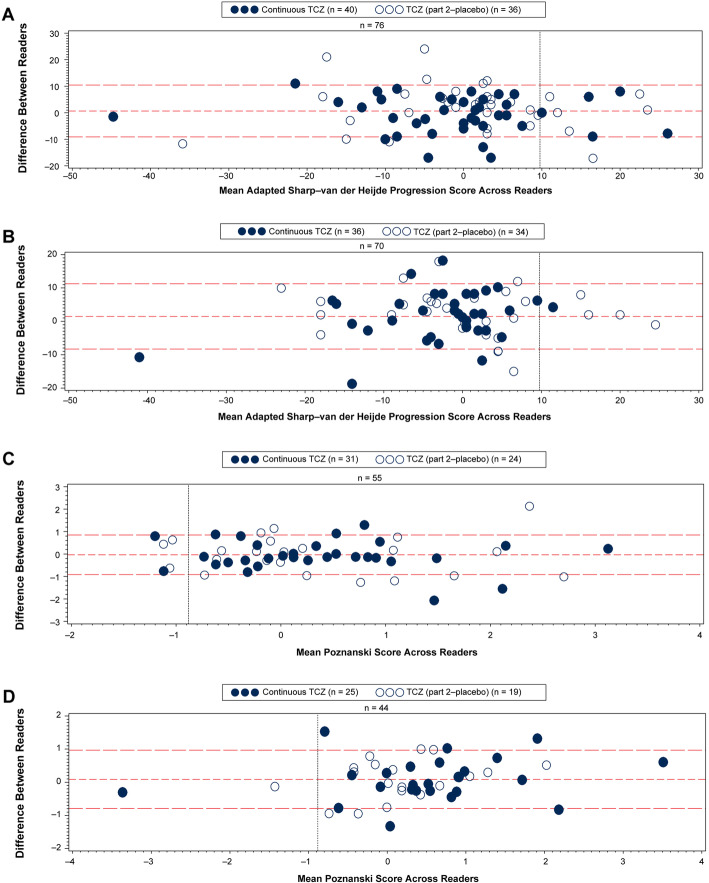
Fig. 2.
Bland and Altman plots of radiographic progression based on SDD in patients with pcJIA. a, b Mean adapted SH progression scores across two reviewers for each patient with radiographic scores at baseline and week 52 (a, n = 76) and baseline and week 104 (b, n = 70). c, d Mean Poznanski scores across two reviewers for each patient with Poznanski scores at baseline and week 52 (c, n = 55) and baseline and week 104 (d, n = 44). SDD thresholds are represented by vertical dashed lines. Patients with adapted SH progression are represented to the right of the vertical line in a and b. Patients with Poznanski progression are represented to the left of the vertical line in c and d. Patients randomly assigned to tocilizumab in part 2 are represented by filled circles; those randomly assigned to placebo in part 2 are represented by empty circles. Horizontal dashed lines represent mean differences between readers ± SDD. In case of discrepancy between readers, radiographs were adjudicated and reread independently so consensus could be reached. pcJIA, polyarticular-course juvenile idiopathic arthritis; SDD, smallest detectable difference; SH, Sharp–van der Heijde; TCZ, tocilizumab

