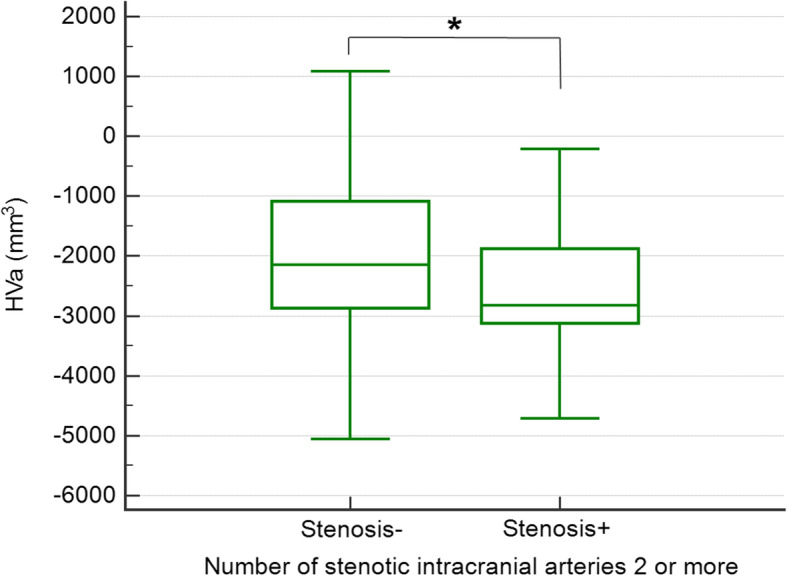
Fig. 1.

Comparison of HVa between the stenosis− and stenosis+ groups for number of stenotic intracranial arteries ≥ 2 in CI subjects. In the box-and-whisker plot, the central box represents the values from the lower to upper quartile, the middle line represents the median, and the horizontal line extends from the minimum to the maximum value. *Adjusted p < 0.05 (after controlling for the effects of age, gender, APOE4, and clinical diagnosis (MCI vs. AD dementia)). HVa, hippocampal volume adjusted for intracranial volume; MCI, mild cognitive impairment; AD, Alzheimer’s disease
