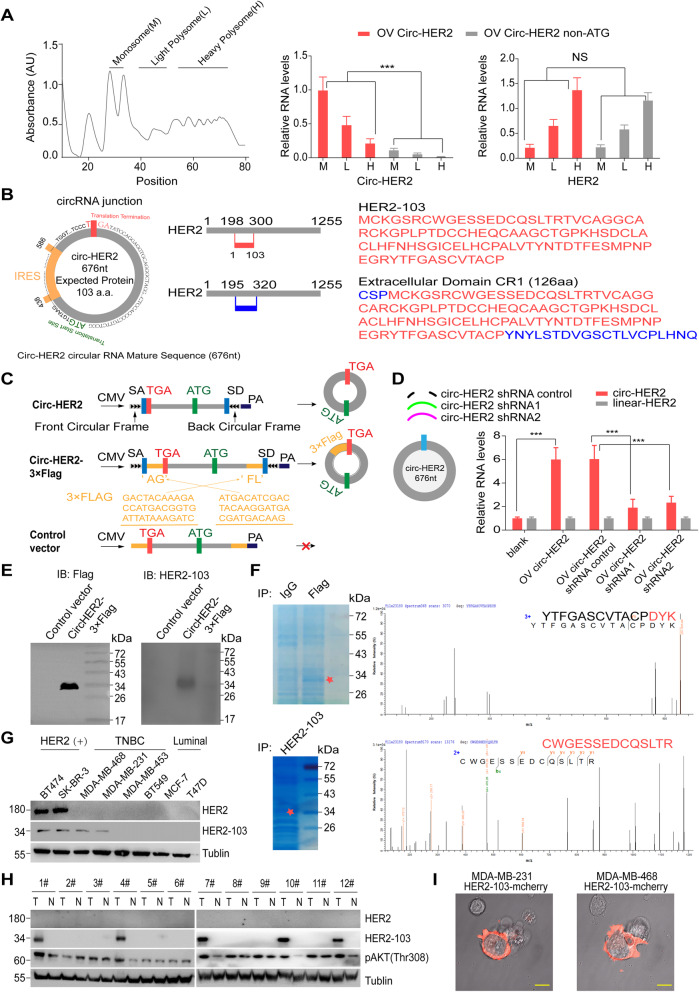
Fig. 3.
Circ-HER2 encodes a 103aa novel protein HER2–103. a Polysome fractions (M, monosome; L, light polysome; H, heavy polysome) in circ-HER2 and circ-HER non-ATC overexpressed 293 T cells were extracted by 5 to 50% sucrose gradient ultracentrifuge. q-PCR using junction specific primers was then performed to analyze the translation potential of circ-HER2. q-PCR using linear specific primers to determine linear HER2’s translation potential was served as positive control. b Left, the putative ORF, IRES and start/stop sites of circ-HER2; Right upper, illustration of HER2–103 amino acid sequence. Right lower, illustration of the extracellular CR I domain amino acid sequences HER2. Different amino acid sequences of CR I domain and HER2–103 was shown in blue. c Illustration of the synthetic circRNA expression plasmid: circ-HER2, exon 3–7 sequences of the HER2 gene were cloned between SA and SD with both sides of flanking repeat sequences (front circular frame and back circular frame); circ-HER2–3 × Flag, exon 3–7 sequences of the HER2 gene were cloned between SA and SD with both sides of flanking repeat sequences as indicated, with 3XFlag tag sequences were separately cloned at both sides; control vector, SA, SD and flanking repeat sequences were removed from circ-HER2–3 × Flag vector to prevent circularization. d Left, circ-HER2 overexpression plasmid as well as two circ-HER2 junction shRNAs and a control shRNA were designed, transfected into HEK293T cells as indicated. Right, relative circ-HER2 and linear HER2 RNA levels were detected by q-PCR using junction specific or linear specific primers. e Total proteins from circ-HER2–3 × Flag or control plasmid-transfected HEK239T cells were prepared, and HER2–103 overexpression was confirmed by immunoblotting using Flag antibody or HER2–103 antibody. f Upper, total proteins from circ-HER2–3 × Flag or control plasmid-transfected HEK239T cells were separated via SDS-PAGE. The gel bands between 26 kD and 43 kD were cut and subjected to LC-MS/MS. The identified Flag-tag amino acids are shown in red; Lower, total proteins from MDA-MB-231 cells were separated via SDS-PAGE. The gel bands between 26 kD and 43 kD were cut and subjected to LC-MS/MS. The identified HER2–103 amino acids were shown in red. g HER2–103 and HER2 were detected by immunoblotting in eight different breast cancer cell lines as indicated. h HER2–103 and HER2 were detected in 12 paired TNBC samples. i HER2–103-mCherry plasmid was transfected to MDA-MB-468 and MDA-MB-231 cells for 72 h, confocal microscope live image was used to show the HER2–103 cellular localization. Scale bars, 20 μm. Lines show the mean ± SD, ***, p < 0.001; **, p < 0.01; *p < 0.05. Data are representative from at least 2–3 experiments with similar results

