Fig. 4.
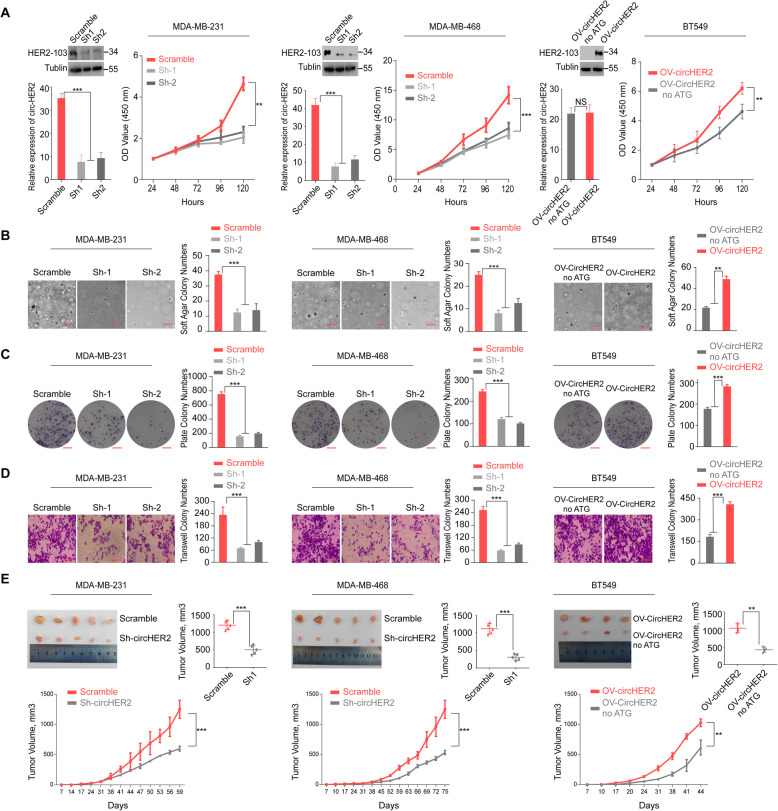
HER2–103 is critical for TNBC cells proliferation and invasion. a Left two panels, MDA-MB-231, MDA-MB-468 cells were stably transfected with scramble or circ-HER2 shRNAs. Circ-HER2 and HER2–103 were decided by immunoblotting and q-PCR. CCK8 cell proliferation assay was performed in above mentioned modified cells. Right, BT549 cells were stably transfected with circ-HER2 noATG vector or circ-HER2 vector. Circ-HER2 and HER2–103 were decided by immunoblotting and q-PCR. CCK8 cell proliferation assay was performed in above mentioned modified cells. b Left two panels, soft agar colony formation assay (3D) in MDA-MB-231 and MDA-MB-468 cells stably transfected with scramble or circ-HER2 shRNAs. Right, soft agar colony formation assay (3D) in BT549 cells transfected with circ-HER2 or circ-HER2 noATG vector. c Left two panels, plate colony formation assay (2D) in MDA-MB-231 and MDA-MB-468 cells stably transfected with scramble or circ-HER2 shRNAs. Right, plate colony formation assay (2D) in BT549 cells transfected with circ-HER2 or circ-HER2 noATG vector. d Left two panels, transwell migration assays of MDA-MB-231 and MDA-MB-468 cells stably transfected with circ-HER2 shRNAs or scramble shRNA. Right, transwell migration assays of BT549 cells transfected with circ-HER2 or circ-HER2 noATG vector. e Left two panels, representative tumor images and in vivo tumor growth curve in the mouse xenograft model implanted with MDA-MB-231 and MDA-MB-468 cells stably transfected with scramble or circ-HER2 shRNAs. Right, representative tumor images and in vivo tumor growth curve in the mouse xenograft model implanted with BT549 cells transfected with circ-HER2 or circ-HER2 noATG vector. Tumor volumes were calculated by: volume = length× (width)2/2. Lines show the mean ± SD, ***, p < 0.001; **, p < 0.01; *p < 0.05. Data are representative from at least 2–3 experiments with similar results. N = 5 mice in each in vivo experiment

