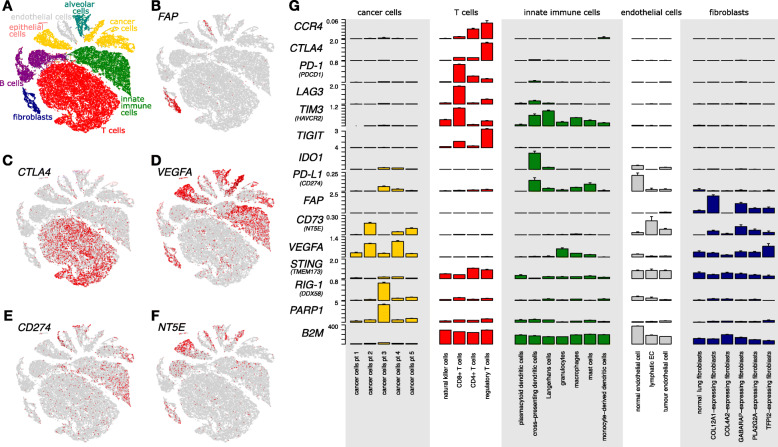
Fig. 2.
The gene expression heterogeneity of the NSCLC TME, illustrated by gene expression in stromal and cancer cells. 52.698 single cells from 4 non-malignant and 15 tumor samples of five patients were analyzed. (a-f) tSNE plots of the 52.698 cells, with (a) clusters color-coded according to the associated class of cell types, or with (b-f) cells colored according to the expression of the indicated marker gene, illustrating the heterogeneity of gene expression by the various cell types within the TME. Gene expression is shown ranging from grey to red (low to high). (e) CD274 is the gene alias for PD-L1. (f) NTE5 is the gene alias for CD73. (g) Expression levels of selected genes (gene alias in brackets), involved in immunomodulation in tumors shown separately for each cell type based on single cell RNA sequencing. Expression levels in cancer cells are shown separately for each patient, while the subtypes of T cells, innate immune cells, endothelial cells and fibroblasts represent pooled patient data. Data are derived from reference [2]

