Fig. 3.
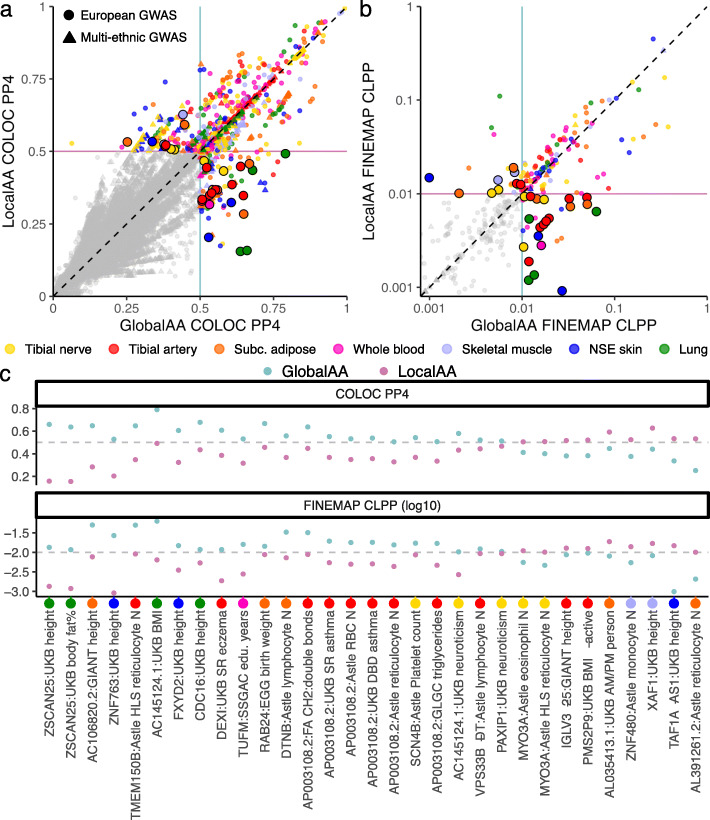
Impact of eQTL ancestry adjustment methods on colocalization with GWAS. a, b We performed colocalization for a subset of loci where LocalAA and GlobalAA called eQTLs with different lead eVariants (nominal P value threshold of 1e−4). Each point represents a GWAS/eQTL colocalization test near a single eGene (colored by eQTL tissue). The x- and y-axes respectively show the posterior probabilities of colocalization using either GlobalAA or LocalAA eQTL signals. The same 31 points highlighted in both plots correspond to loci where one ancestry-adjusted eQTL signal colocalized but the other did not, with concordant results between two colocalization methods. a Colocalization was performed with COLOC for all loci where LocalAA and GlobalAA called eQTLs with different lead eVariants (nominal P value threshold of 1e−4). A posterior probability of colocalization (PP4) threshold of 0.5 was used to identify colocalization events with COLOC. b For the subset of loci for which COLOC reported a colocalization (i.e., colored points in a), colocalization was also performed with FINEMAP. Colocalization posterior probabilities (CLPPs) are shown on a log10 scale. A CLPP threshold of 0.01 was used to identify colocalization events with FINEMAP. c Colocalization posterior probabilities are provided for the 31 loci highlighted in a and b. Larger values indicate stronger colocalization. The associated eQTL tissues are indicated with colored circles and tick marks below the x-axis. SR, self-reported; DBD, diagnosed by doctor; N, count

