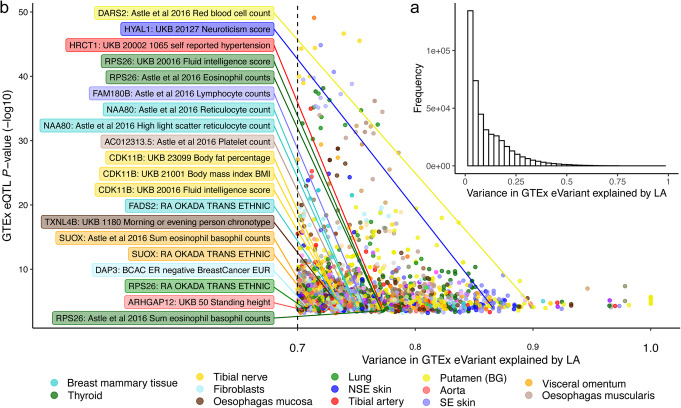
Fig. 4.
Correlation between genotype and local ancestry in GTEx v8 eVariants. For all eVariants reported by the overall GTEx v8 eQTL calling pipeline, we calculated the correlation between genotypes and local ancestry using the full GTEx v8 cohort. a The majority of GTEx v8 eVariants are not confounded by local ancestry when all 838 genotyped individuals are considered. b Local ancestry explains more than 70% of the variance in genotypes for a subset of GTEx v8 eVariants. Unlike a, b considers only individuals with matched genotype and gene expression data for each tissue, which reflects the sample used to call these significant associations. eQTLs with posterior probabilities of GWAS colocalization of at least 0.5 (COLOC PP4 > 0.5) are labeled with the eGene and GWAS trait

