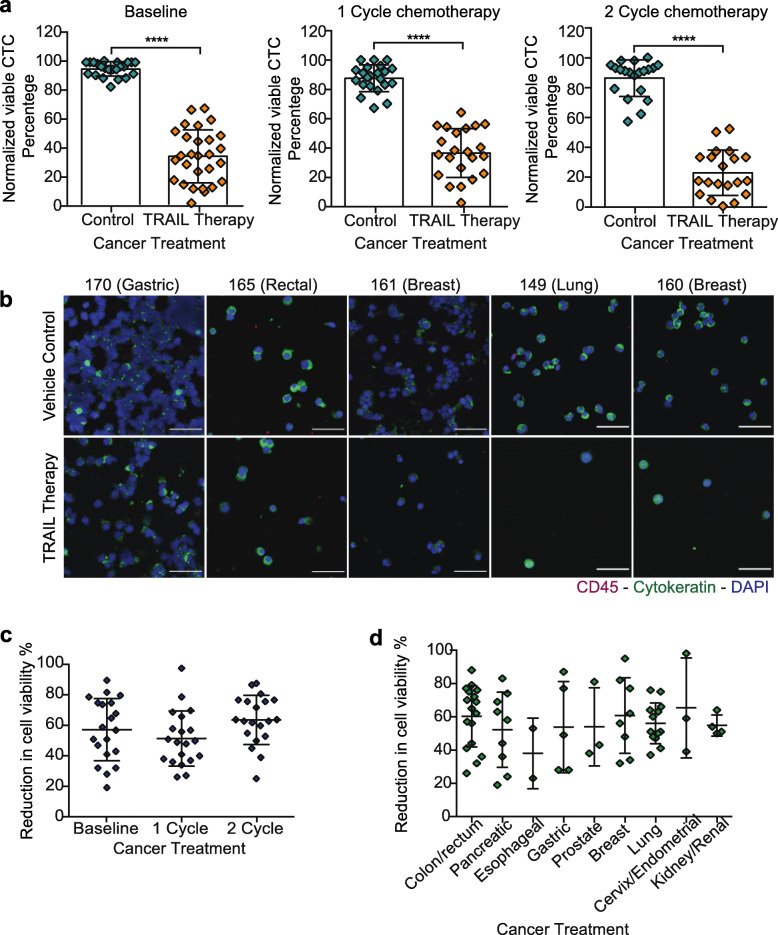
Fig. 5.
TRAIL-based liposomal therapy killed CTCs from metastatic cancer patients. a Scatter dot charts represent the normalized cell viability percentage of CTCs treated with vehicle control and TRAIL-based liposomal therapy in flowing blood for 4 h at different time points of cancer treatment: Baseline, 1 cycle of chemotherapy and 2 cycles of chemotherapy (mean ± SD, N = 68 from 26 cancer patients). Significant decrease (****P < 0.0001) of CTC in treated samples was calculated using a paired t test. b Immunofluorescence photomicrographs of CTCs remaining after being treated in flowing blood with vehicle control and TRAIL-liposomal therapy in patients with gastric, rectal, breast and lung cancer (CD45 is red, Cytokeratin is green and DAPI is blue). Scale bar is 40 μm. c Scatter dot charts represent the reduction in cell viability percentage in treated samples with TRAIL-based liposomal therapy before and after chemotherapy (mean ± SD, N = 65 from 26 patients). Non-significant increase (P = 0.1424) in killing rate of CTC after receiving 1 or 2 cycles of chemotherapy was calculated using one-way ANOVA (repeats matched) test. d Scatter dot plots represent the variation in cell viability reduction percentage in treated samples with TRAIL-liposomal therapy by cancer type (mean ± SD, N = 65 from 26 patients). There were no significant differences (P = 0.2514) in the mean CTC reduction by cancer type as determined with one-way ANOVA

