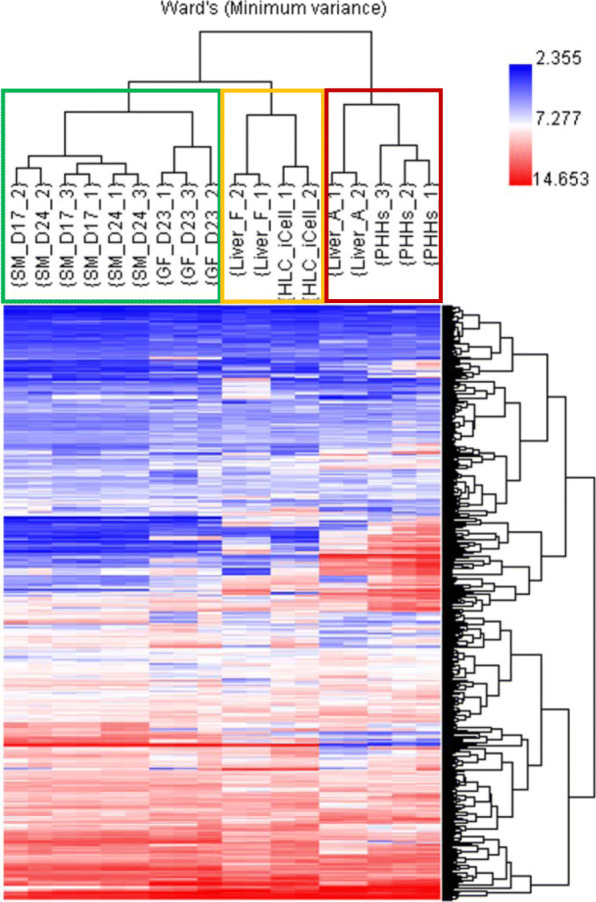
Fig. 5.

Hierarchical clustering analysis (HCA) of all the samples. The clustering was based on 520 probesets representing hepatotoxicity-related genes, drug-metabolizing enzymes, transporters, and nuclear receptors (see main text). The list of genes is provided in Supplemental Table 1. The clustering was performed through Ward’s minimum variance linkage on normalized expression data. The dendrogram on the right of the image shows clusters of genes (names not shown), while that on the top of the image shows clusters of samples with names shown. SM, small molecule; GF, growth factor; D, day of differentiation; Liver_F, fetal liver; Liver_A, adult liver; HLC_iCell, iCell hepatocyte-like cells (FCDI); PHHs, primary human hepatocytes
