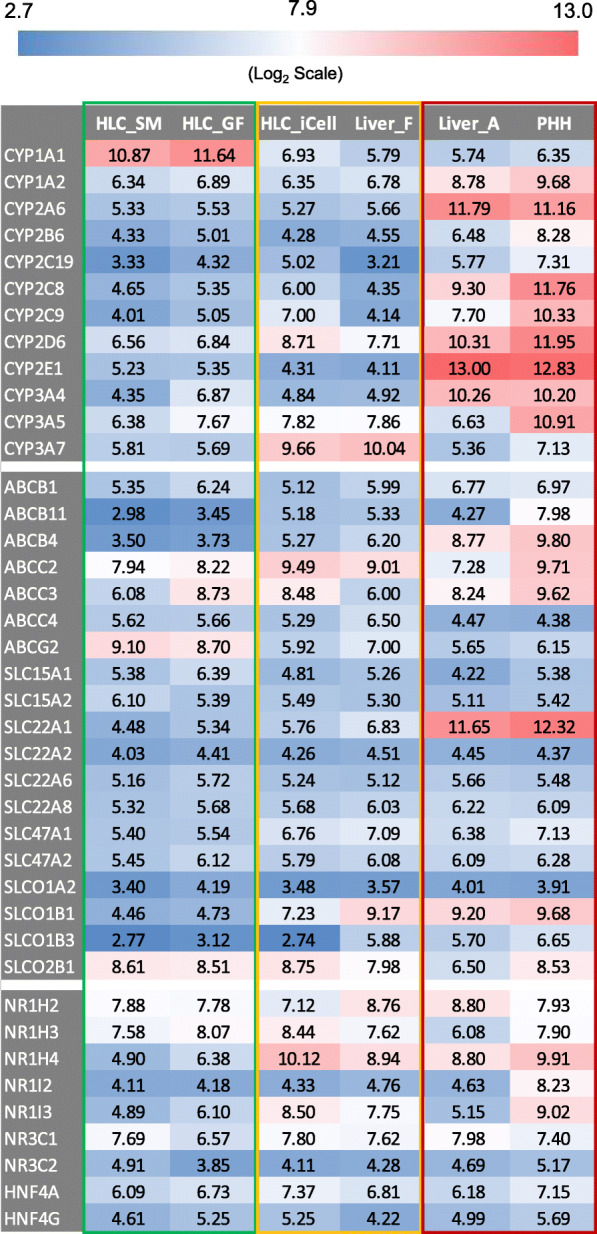
Fig. 6.

Relative gene expression of major cytochromes P450 enzymes (top), functional transporters (middle), and nuclear receptors (bottom). Gene expression value for each enzyme, transporter, or nuclear receptor was the average of the samples in each group and is in log2 scale and color-coded as shown in the scheme located at the top of the figure. HLC_SM, hepatocyte-like cells derived using small molecules; HLC_GF, hepatocyte-like cells derived using growth factors; HLC_iCell, iCell hepatocyte-like cells (FCDI); Liver_F, fetal liver; Liver_A, adult liver; PHHs, primary human hepatocytes
