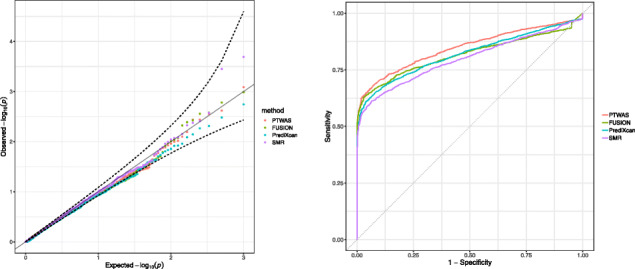
Fig. 2.

Type I error control and power in hypothesis testing of causal relationships by various methods in TWAS. The left panel shows the QQ-plot of testing p values as the simulated data are specifically generated from the null scenario. All methods properly control the type I errors. The right panel shows the receiver operating characteristic (ROC) curves by different methods when the simulated data are from a mixture of null and alternative scenarios. At any specified value of the false-positive rate, PTWAS shows the highest true-positive rate among compared methods. All methods utilizing multiple independent eQTLs show higher powers than SMR (which uses a single best eQTL of each gene as the corresponding instrument)
