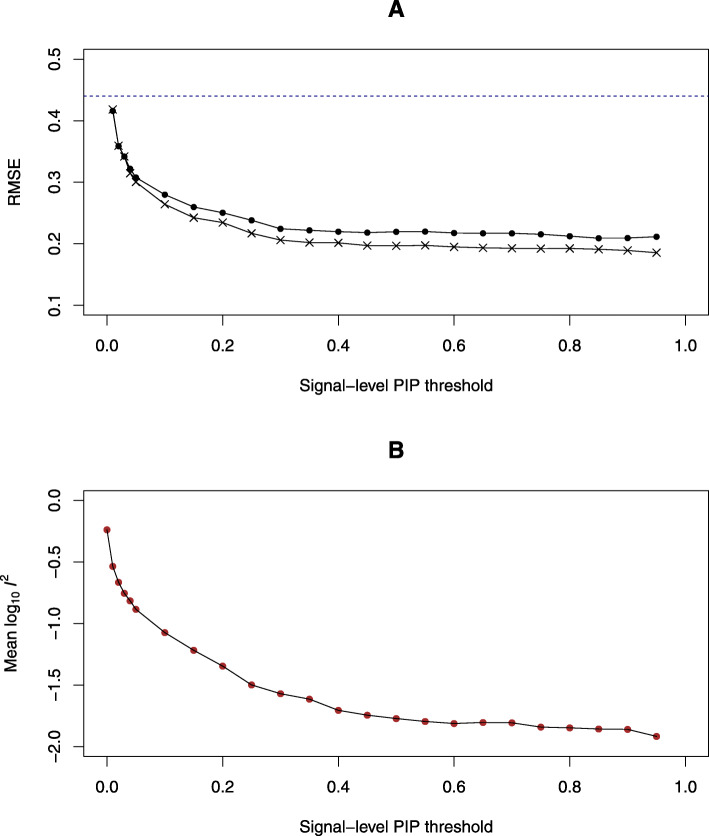
Fig. 4.
Impact of strength of eQTLs on causal effect estimation in PTWAS 800 genes that pass the initial PTWAS scan (p value ≤0.05) are used in this experiment. Panel a illustrates the relationship between the accuracy of the estimation (measured by rooted mean square error, RMSE) and the strength of the eQTL instruments (measured by signal-level PIP). The filled points represent all the genes satisfying the SPIP threshold. The stars represent the subset of genes where multiple independent qualifying eQTL instruments are available. The dotted line represents the RMSE by SMR. Overall, estimation accuracy increases when the strength of eQTL instruments improves and utilizing multiple instruments increases the accuracy of the estimation. Panel b shows the average heterogeneity of causal effects estimated from multiple independent eQTLs. Each data point represents the I2 (at log10 scale) value averaged over the genes having at least two independent eQTLs satisfying the SPIP threshold. As expected, the computed heterogeneity decays fast as the strength of the eQTLs is increased

