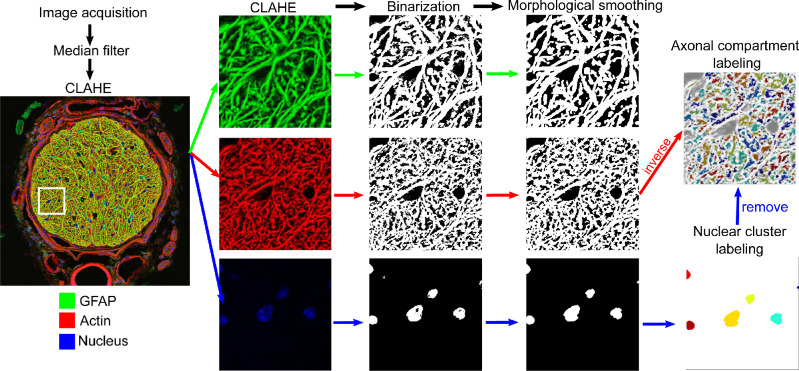
Figure 1.
A series of image processing steps were applied to the fluorescent images to measure the features of the ON. The fluorescent image was post-processed using a median filter and contrast-limited adaptive histogram equalization and the results are shown in a 42 µm × 42 µm area for GFAP, actin and nuclear channel. Each channel was then binarized using the Otsu thresholding method28 and morphologically smoothed. The final binarized image of GFAP channel was used for structural measurements, while those of actin and nucleus channels were further inverted to locate the axonal space. Each disconnected axonal space was randomly labelled as a separate axonal compartment and each isolated nuclear area was randomly labelled as a separate nuclear cluster for visualization.

