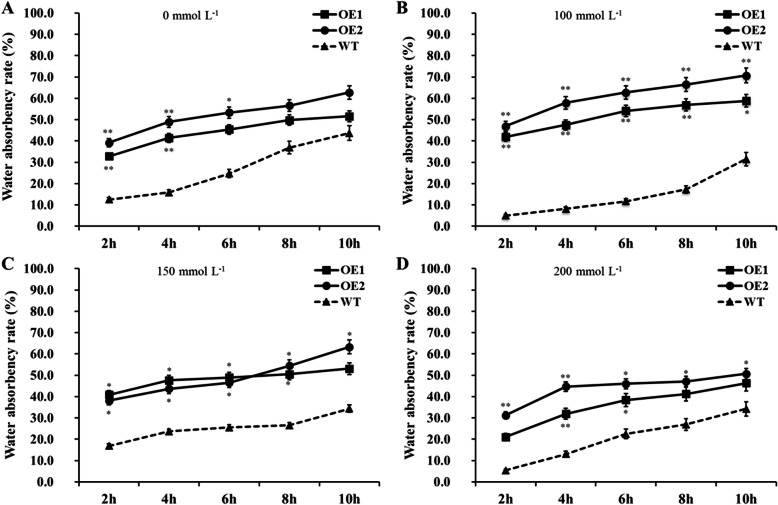
Fig. 7.
The water absorbency rate in imbibed germination stage of transgenic lines (OE1 and OE2) and wild-type (WT) line exposed to solution containing different NaCl concentrations (mmol·L− 1). a, control, represented the water absorbency rates of transgenic lines and wild type line exposed to distilled water (0 mmol·L− 1 NaCl concentration). B, C, and D represented the water absorbency rates of transgenic lines and wild type line exposed to solution with different NaCl concentrations, (b) 100 mmol·L− 1, (c) 150 mmol·L− 1, and (d) 200 mmol·L− 1, respectively. *, p-value < 0.05; **, p-value < 0.01

