Fig. 1.
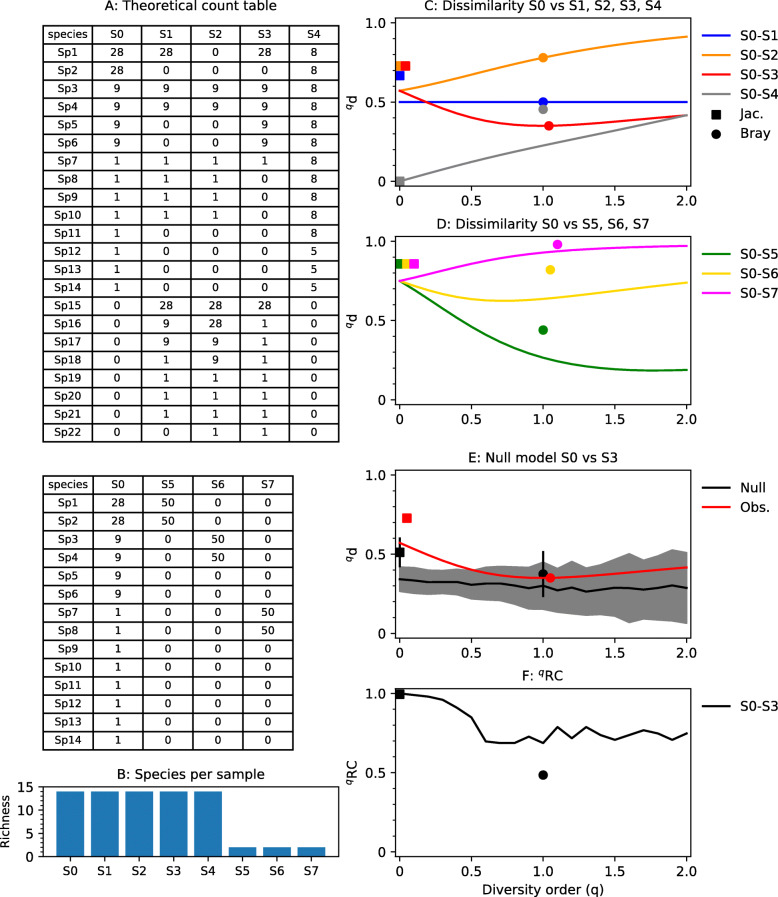
Behavior of dissimilarity indices with a theoretical data set. a Theoretical count table and b richness of each sample. c Behavior of dissimilarity indices for samples with equal species abundance distribution, sharing exactly half of the abundant, intermediate, and rare species (S0–S1); sharing no abundant but half of the rare and intermediate species (S0–S2); or sharing all the intermediate species but only half of the rare and abundant (S0–S3). S0–S4 share all species but have different species abundance distributions. d Behavior of dissimilarity indices for samples having different richness (14 in S0 and 2 in S5–S7). In S0–S5, the shared species are the same as the most abundant in S0; in S0–S6, the shared species are those of intermediate abundance in S0; and in S0–S7, the shared species are rare in S0. e, f Null model analysis comparing observed dissimilarity to the null expectation for samples S0–S3. The black line and shaded region in e show the average and standard deviation for the null expectation based on 99 randomizations. Observed dissimilarity and the null expectation (e), and qRC values (f) for the Jaccard (squares) and Bray-Curtis (circles) indices are also shown

