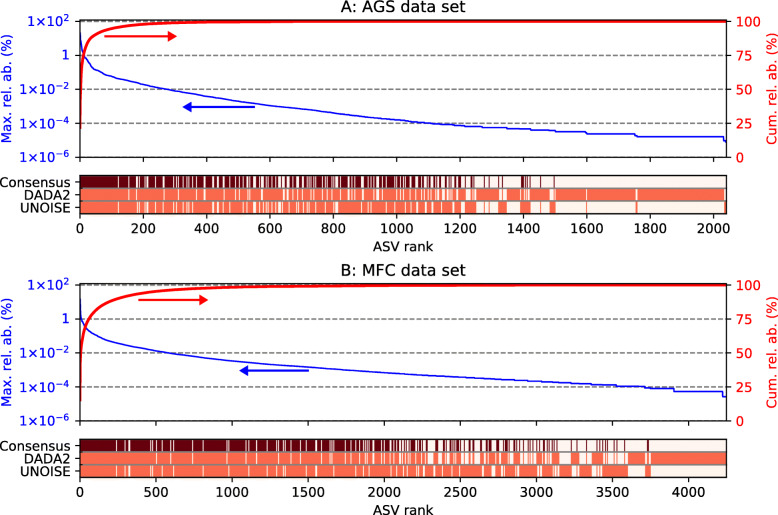
Fig. 2.
Relative abundance (%) of ASVs retained in the consensus tables for the AGS (a) and MFC (b) data sets. Each ASV in the two input tables, arranged from highest to lowest relative abundance, is shown on the x-axis. The blue lines show the maximum relative abundances of the ASVs in the DADA2 and UNOISE count tables, and the red lines show the cumulative relative abundances. The heatmaps show whether the ASVs were detected in the DADA2 and UNOISE count tables (light red). If it was detected in both, it was also retained in the consensus table, which is indicated by dark red color

