Fig. 1.
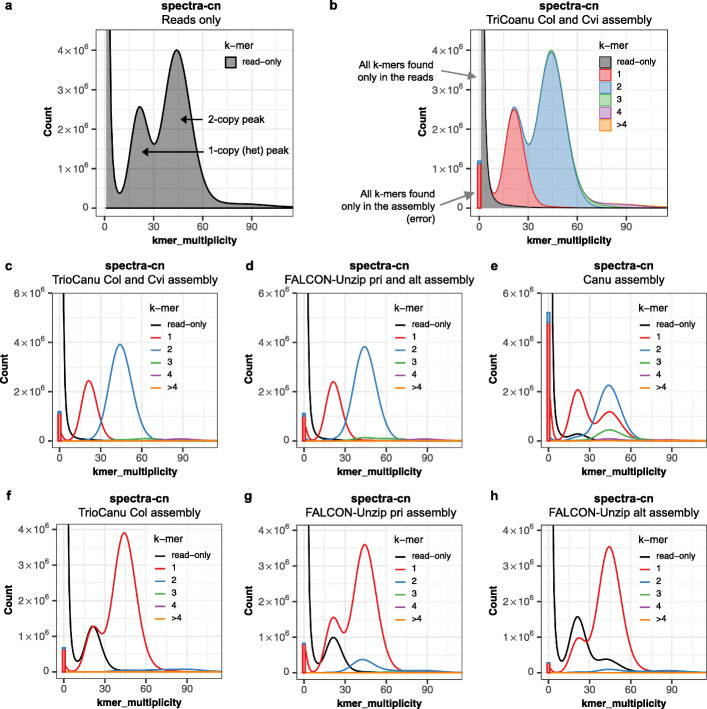
Merqury copy number spectrum plots for haploid and diploid assemblies of an Arabidopsis thaliana F1 hybrid genome. a Histogram of k-mer multiplicity collected from Illumina reads. By default, Merqury connects the midpoint of each histogram bin with a line, giving the illusion of a smooth curve. The first peak represents 1-copy (heterozygous) k-mers in the genome, and the second peak represents 2-copy k-mers originating from homozygous sequence or haplotype-specific duplications. Depth of sequencing coverage determines where these peaks appear. In this example, sequencing coverage is approximately 45×, corresponding to the 2-copy peak. b Copy number spectrum (spectra-cn) of the same k-mers in a plotted as stacked histograms colored by the copy numbers found in the combined TrioCanu assembly. The assembly k-mers absent from the read set (likely to be base errors in the assembly) are plotted as a bar at zero multiplicity, colored by the copy numbers found in the assembly. c Unstacked histograms of b for visualizing the distribution of k-mer counts per copy numbers found in the assembly. This plot shows an ideal pseudo haplotype assembly. d Spectra-cn plot of the combined FALCON-Unzip assembly. e Spectra-cn plot of the mixed-haplotype Canu assembly. Missing single copy k-mers (black) and k-mers from artificial duplications (green, purple, yellow in 30–60×) are noticeable. Note this assembly was not polished and so has a larger error k-mer bar. f Spectra-cn plot of the TrioCanu Col haplotype assembly. Half the single copy k-mers are missing and found in the other haplotype (black). Two-copy k-mers are found once (red) in each haplotype assembly. g Spectra-cn plot of the FALCON-Unzip primary assembly. h Spectra-cn plot of the FALCON-Unzip alternate assembly

