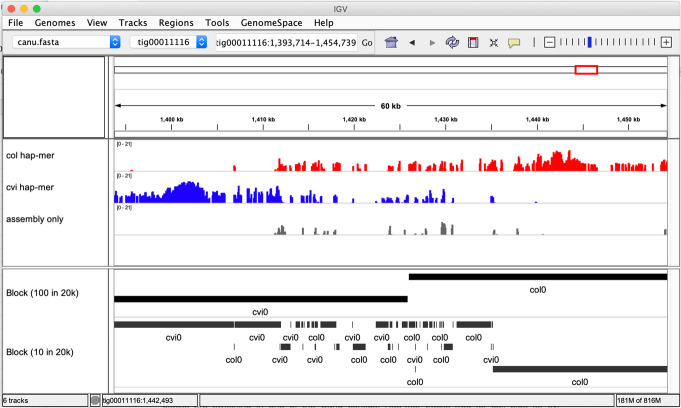
Fig. 5.
Example k-mer and phasing tracks provided by Merqury. Hap-mer density is provided in tiled data format (.tdf) browsable with the Integrated Genomics Viewer (IGV) [37, 38]. This figure shows a region where haplotype blocks are switching within one of the Canu contigs. Hap-mer tracks show haplotype switches from Cvi (blue) to Col (red), along with k-mers found only in the assembly (gray), which are likely caused by erroneous consensus bases. Phase blocks (black) are shown for both relaxed (100 consecutive switches allowed per 20 kbp) and strict (10 per 20 kbp) switching thresholds

