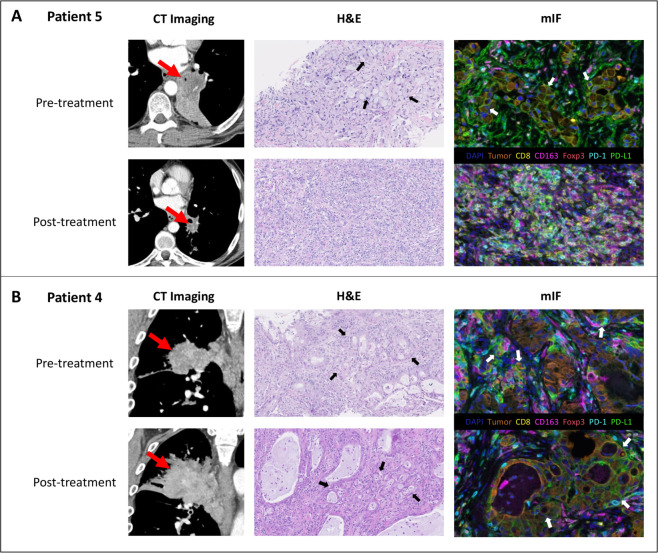
Figure 2.
Radiographic and pathologic response to neoadjuvant nivolumab plus ipilimumab for (A) patient with pathologic complete response (pCR) and (B) no pathologic response to treatment. (A) Radiographic and pathologic response for patient 5 with pCR to neoadjuvant nivolumab plus ipilimumab. Pre-treatment contrast-enhanced CT imaging demonstrates a 4.4×4.2 cm left lower infrahilar mass (red arrow) encasing adjacent bronchi with posterior post-obstruction atelectasis. Pre-treatment biopsy demonstrates abundant infiltrating malignant signet ring cells distinguished by atypical eccentric nuclei surrounding a large mucinous vacuole (black arrows). The pre-treatment tumor shows abundant PD-L1 positive tumor and stromal cells (PD-L1 in green, cytokeratin expression in orange highlights tumor cells (white arrows)). Post-treatment pre-resection imaging demonstrates decreased size of mass now measuring 2.2×2.7 cm (red arrow) with re-expansion of previously collapsed lung. Post-treatment resection tissue shows abundant inflammatory cells, cellular fibrosis and neovascularization; features typical of immune-mediated tumor regression. Multiplex immunofluorescence (mIF) highlights abundant cytotoxic T cells (CD8, yellow) and macrophages (CD163, magenta), as well as scattered regulatory T cells (Foxp3, red). No residual tumor cells are identified (note the absence of orange tumor cells on mIF), consistent with pCR. (B) Radiographic and histologic findings for patient 4 with primary tumor progression preventing definitive surgery. Pre-treatment contrast-enhanced CT imaging demonstrates a 6.8×6.5 cm posterior right upper lobe mass (red arrow) encasing the right upper lobe bronchus. Post-treatment imaging demonstrates enlargement of mass to 8.3×6.9 cm (red arrow) with worsening encasement and enlarging paratracheal adenopathy. On assessment of pre-treatment and post-treatment biopsies, atypical glandular structures (black arrows), including confluent (cribriform) glands, are present with no histologic evidence of tumor regression in post-treatment specimen. PD-L1 expression (green) is seen on tumor cells (orange, white arrows) both pre-treatment and post-treatment. Scant pre-treatment and post-treatment inflammatory infiltrates are composed largely of macrophages (CD163, magenta), which are predominantly localized to the intra-tumoral stroma. H&E photomicrographs taken at ×200 original magnification. mIF images taken at ×400 original magnification. mIF, multiplex immunofluorescence.

