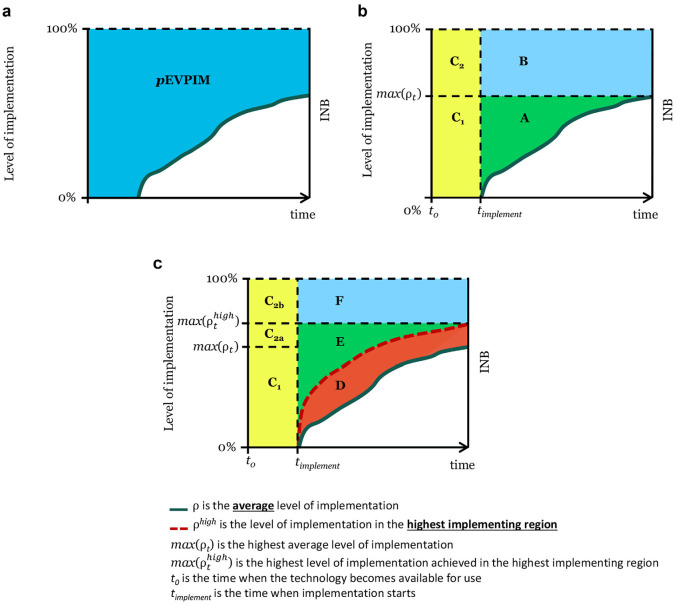
Figure 1.
Stylised example illustrating (a) the population expected value of perfect implementation (pEVPIM); (b) the expected value of eliminating slow (A), low (B) and delayed (C = C1 + C2) implementation; and (c) the expected value of eliminating regional implementation variation (D).
 ρ is the average level of implementation.
  ρhigh is the level of implementation in the highest implementing region. max(ρt) is the highest average level of implementation. max() is the highest level of implementation achieved in the highest implementing region. t0 is the time when the technology becomes available for use. timplement is the time when implementation starts.

