Figure 1.
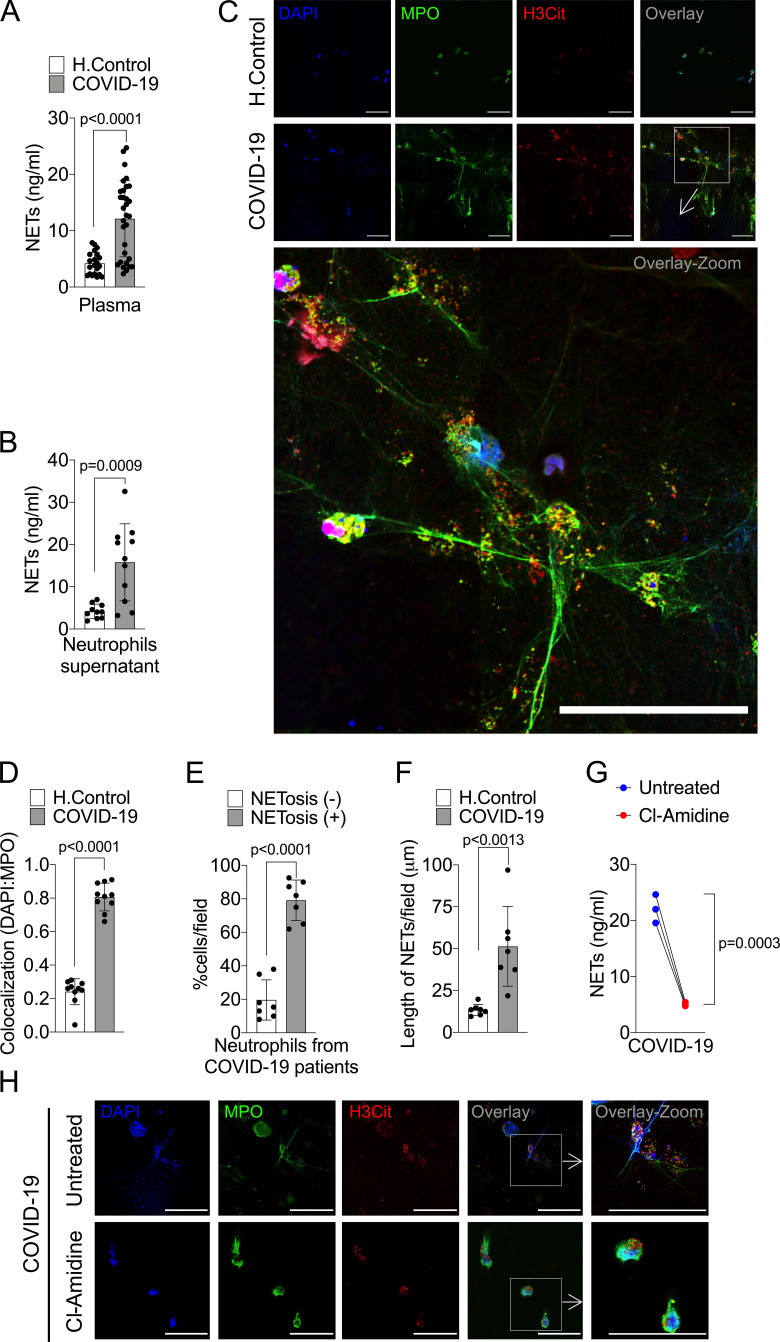
COVID-19 patients produces high concentrations of NETs. Plasma and neutrophils were isolated from healthy controls and COVID-19 patients. (A) NET quantification by MPO-DNA PicoGreen assay in plasma from healthy controls (H.Control; n = 21) or COVID-19 patients (n = 32). (B) Supernatants from cultures of blood isolated neutrophils from healthy controls (n = 10) or COVID-19 patients (n = 11). NET quantification was performed using MPO-DNA PicoGreen assay. (C) Representative confocal analysis of NETs release by neutrophils isolated from healthy controls (n = 10) or COVID-19 patients (n = 11), cultured for 4 h at 37°C. Cells were stained for nuclei (DAPI, blue), MPO (green), and H3Cit (red). Scale bar indicates 50 µm. (D) Colocalization of DAPI and MPO between healthy controls (n = 10) and COVID-19 (n = 10). The data depicts Pearson’s correlation coefficient assessed by Fiji/ImageJ software. (E) Percentage of NETosis in neutrophil from COVID-19 patients (n = 7). (F) NET length quantification. (G) NET quantification by MPO-DNA PicoGreen assay in the supernatants of blood-isolated neutrophils from COVID-19 patients (n = 3) preincubated, or not, with PAD-4 inhibitor (Cl-Amidine; 200 µM) for 4 h at 37°C. (H) Representative confocal images showing the presence of NETs in isolated neutrophils from COVID-19 patients, treated or not, with Cl-Amidine (200 µM). Cells were stained for nuclei (DAPI, blue), MPO (green), and H3Cit (red). Scale bar indicates 50 µm. Data are representative of at least two independent experiments and are shown as mean ± SEM. P value were determined by two-tailed unpaired (A, B, and D–F) or paired (G) Student t test.

