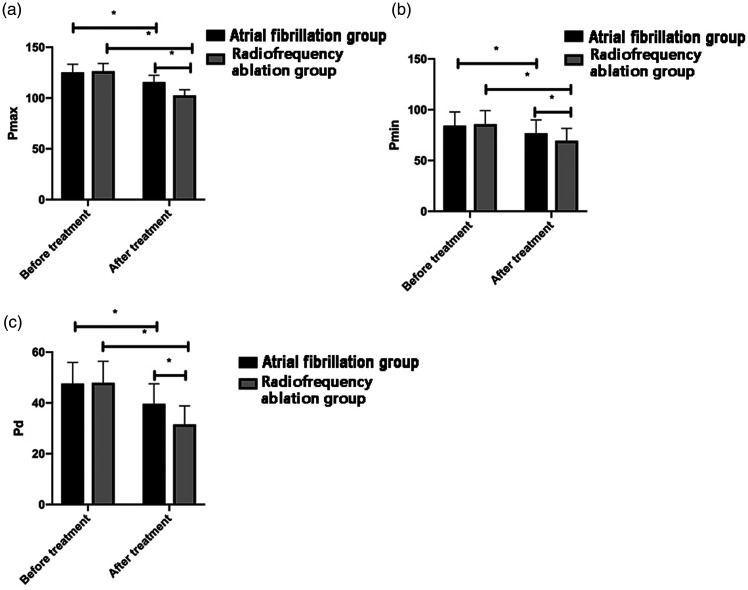
Figure 2.
Comparison of electrocardiography between the groups before and after treatment. a: After treatment, Pmax was significantly decreased in both groups, but this decrease was more pronounced in the radiofrequency ablation group B. b: After treatment, Pmin was significantly decreased in both groups, but this decrease was more pronounced in the radiofrequency ablation group. c: After treatment, Pd was significantly decreased in both groups, but this decrease was more pronounced in the radiofrequency ablation group.
Pmin, minimum P-wave duration; Pmax, maximum P-wave duration; Pd, P-wave dispersion. *P < 0.05.

