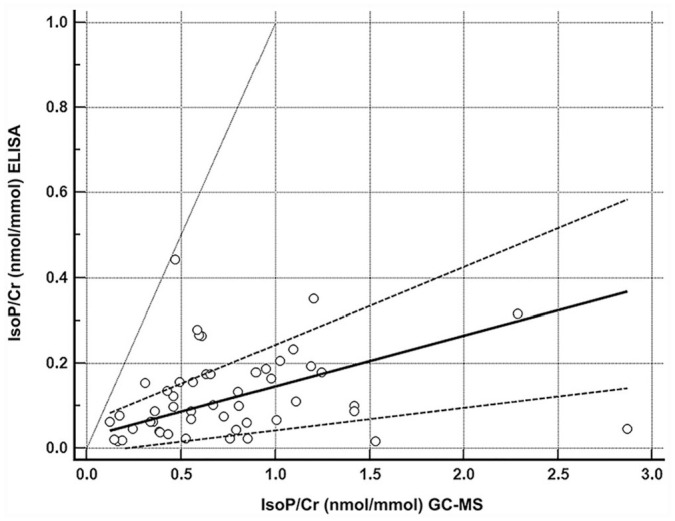
Figure 1.

Passing–Bablok regression depicting the comparison of means to differences between the 2 methods (ELISA and gas chromatography–mass spectrometry, GC-MS) of urinary F2-isoprostane measurement normalized to creatinine (IsoP/Cr) in cats. The open circles represent the 50 cats. The solid line is the regression line, with the dashed lines representing the 95% CI of this regression. The gray line indicates the identity line (x = y), which would indicate perfect agreement between the 2 methods.
