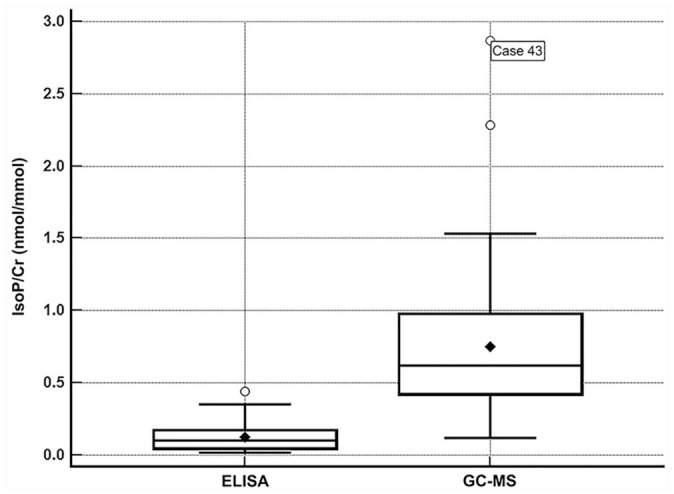
Figure 3.

Box-and-whisker plot depicting the concentrations of urinary isoprostanes normalized to creatinine (IsoP/Cr) detected in 50 cats, with a comparison between methods (ELISA and gas chromatography–mass spectrometry, GC-MS). The height of the box represents the interquartile range, and the horizontal line inside the box represents the median; the closed diamond represents the mean. The whiskers represent the range; outliers are represented by open circles. Isoprostanes were significantly higher when measured by the GC-MS method compared to ELISA (p < 0.0001).
