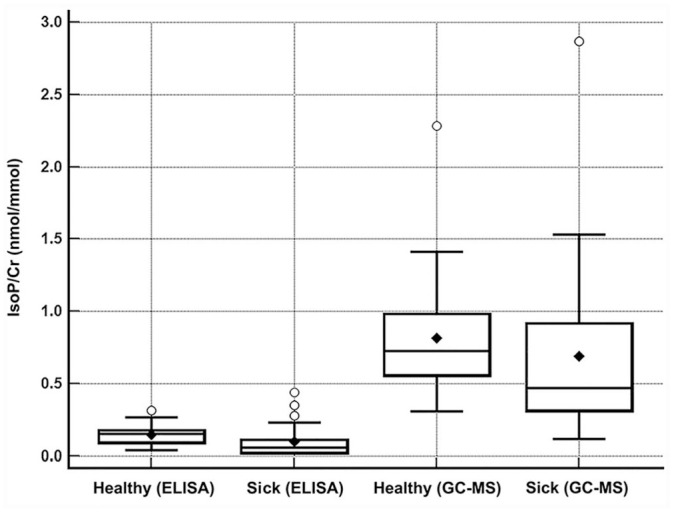
Figure 4.

Box-and-whisker plot depicting the concentrations of urinary F2-isoprostanes normalized to creatinine (IsoP/Cr) detected in 50 cats, comparing health status and methods (ELISA and gas chromatography–mass spectrometry, GC/MS). The concentration of F2-isoprostanes in sick cats, measured by ELISA, was significantly lower than in healthy cats (p = 0.0002); there was no difference when measured by GC-MS (p = 0.068).
