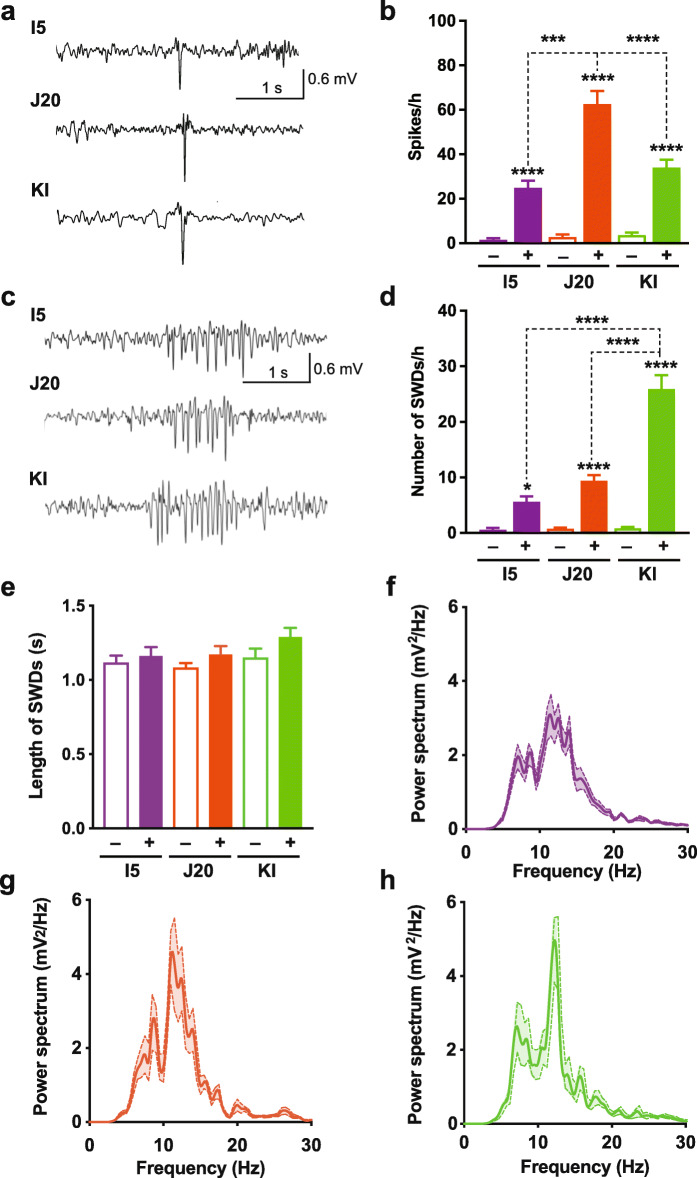
Fig. 4.
Non-convulsive epileptiform activity. Intracranial EEG recordings were obtained in the resting state from 8 to 12-month-old genetically modified mice (+) and WT controls (−). a Traces depict typical epileptiform spikes. b Spike frequencies measured during a 12-h period. c Representative SWDs. d, e Frequency (d) and length (e) of SWDs measured during a 12-h period. n = 10–12 mice per group. f–h Power spectral density analysis (n = 5 mice per group). Two waveforms were analyzed per genetically modified mouse. Note the spectral peak at 12 Hz. **P < 0.01, ***P < 0.001, ****P < 0.0001 vs. WT from same line or as indicated by brackets, based on one-way ANOVA followed by Holm-Sidak test. Values are means ± SEM

