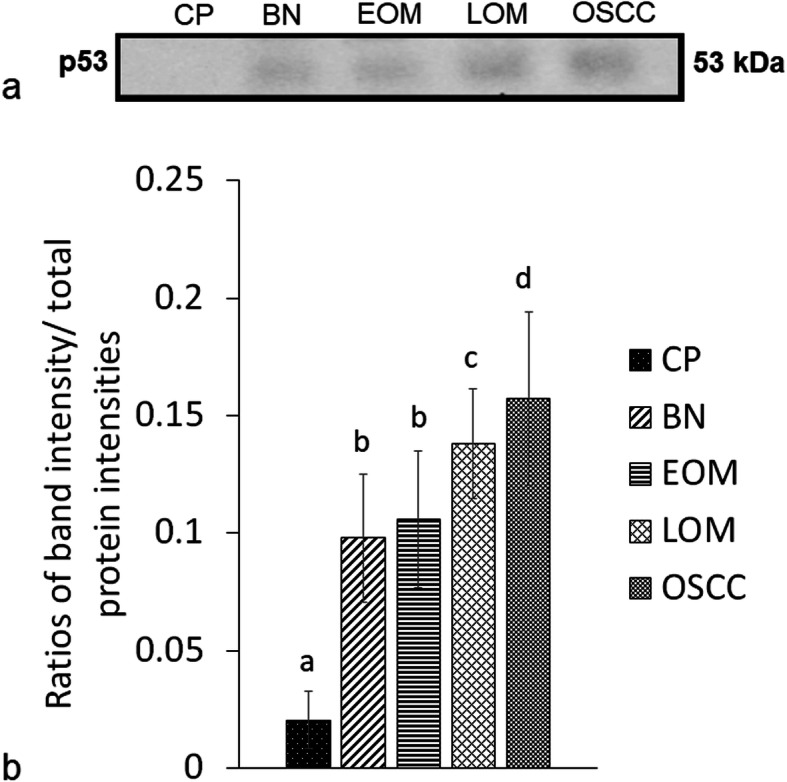
Fig. 4.

Western blot analysis of salivary tumor protein p53 (p53) of dogs with benign oral tumors (BN), early- and late-stage oral melanoma (EOM and LOM, respectively), oral squamous cell carcinoma (OSCC) and periodontitis and normal controls (CP); a representative western blot for P53 at 53 kDa; b bar graph of ratios of P53 protein intensity to total blotted proteins in each lane in a membrane; a-b denote a significant difference at P < 0.05; a-c denote a significant difference at P < 0.01; a-d denote a significant difference at P < 0.001
