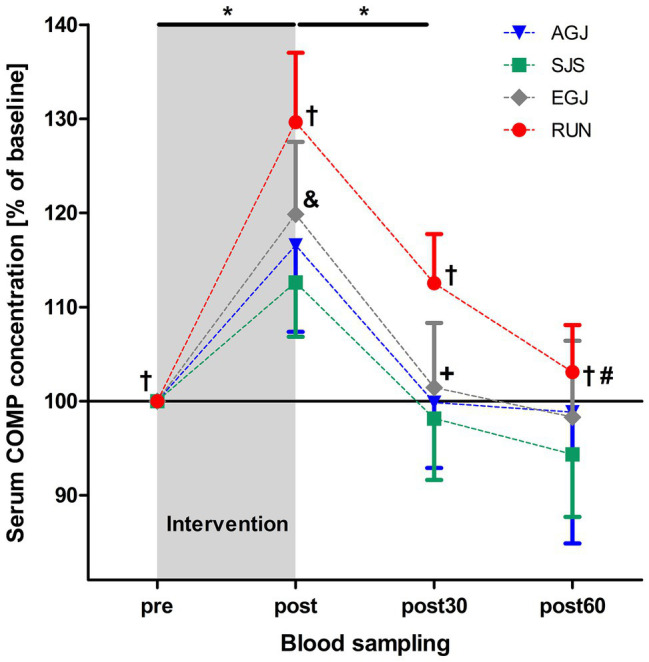
Figure 6.

Mean (and 95% CI) serum COMP concentrations as percent of baseline values directly before (pre), immediately after (post), as well 30 min (post30) and 60 min (post60) after exercise for AGJ, SJS, EGJ, and RUN (N = 15). *Significantly (p < 0.001) different compared to the preceding time point within the same loading protocol for AGJ, SJS, EGJ and RUN. #Significantly (p < 0.001) different compared to the preceding time point for RUN within the same loading protocol. †Significantly (p < 0.05) different compared to all other loading protocols for RUN within the same time point. &Significantly (p < 0.05) different compared to all other loading protocols for EGJ within the same time point. +Significantly (p < 0.05) different between the AGJ and the EGJ protocol within the same time point.
