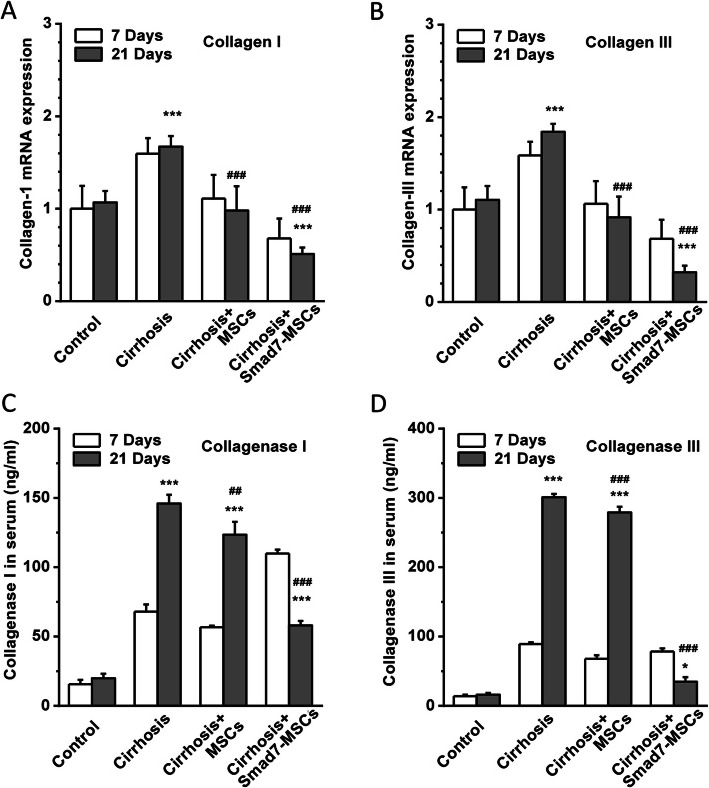
Fig. 3.
Detection of fibrosis biomarkers collagen and collagenase. a Real-time PCR detection of collagen I and collagen III expression in the liver tissues treated with Smad7-MSCs, comparing with the control (vehicle), cirrhosis group (with CCl4 injection) and the cirrhosis group treated with MSCs (n = 6 for each group). b Quantification of collagen III mRNA (n = 6 for each group). c ELISA detection of collagenase 1 and collagenase III (d) in rat serum (n = 4 for each group). *P < 0.05 or ***P < 0.001 comparing with the control group; ##P < 0.01 or ###P < 0.001 comparing with the cirrhosis group

