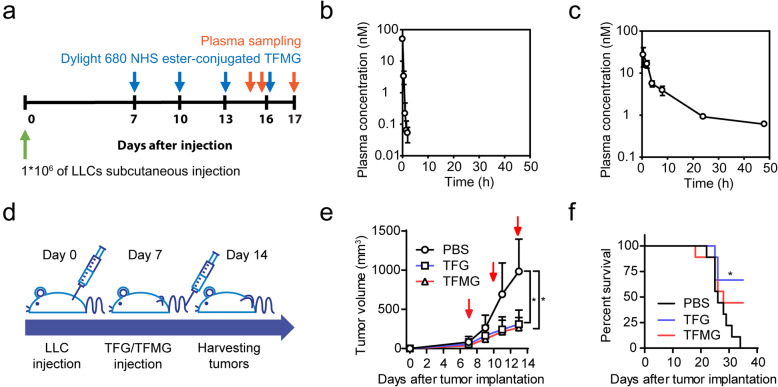
Fig. 1.
TGMG exhibits high pharmacokinetic stability and PCNs suppress tumor growth in vivo. a Schematic diagram depicting the schedule of TRAF or TFMG treatment and plasma sampling in LLC allograft models. LLC tumor-bearing mice, following LLC cell inoculation, were administered TRAF peptide (10 nmol/kg), TFMG (10 nmol/kg), or vehicle control (PBS) subcutaneously. The blue arrowheads represent the point of TRAF or TFMG administration and the red arrowheads represent the point of plasma sampling. b, c Plasma concentrations of TRAP (b) and TFMG (c) in LLC tumor-bearing mice following intravenous injection of TRAP (10 nmol/kg) or TFMG (10 nmol/kg), respectively (n = 3). d Schematic diagram depicting the development of the LLC allograft models and treatment schedule. LLC tumor-bearing mice, following LLC cell inoculation, were administered TFG (10 nmol/kg), TFMG (10 nmol/kg), or vehicle control (PBS) intravenously on days 7, 10, and 13. The tumors were sampled on day 14. e Pattern of tumor growth in LLC tumor-bearing mice treated with TFG, TFMG, or vehicle control (PBS). Tumor volumes were measured on days 7, 9, 11, and 13. The red arrowheads represent the point of TFG/TFMG administration (n ≥ 9). f Survival curves of the LLC tumor-bearing mice. Data information: Data are presented as the mean ± SD. Significant enrichment: *P < 0.0001 (two-way ANOVA) in (e); *P < 0.01 (Mantel-Cox test) in (f)

