Fig. 2.
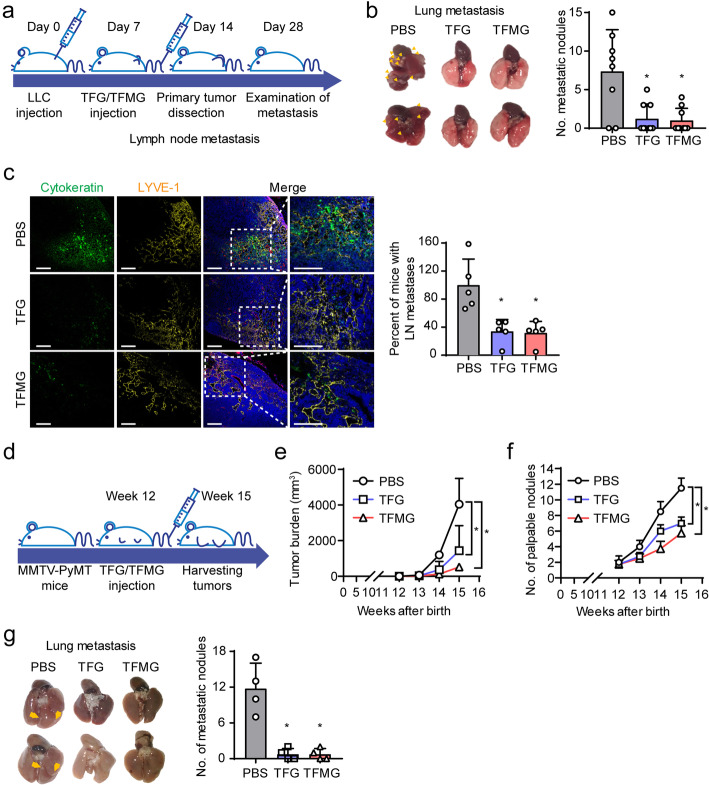
TFG and TFMG suppresses metastasis in mouse models. a Schematic diagram depicting the generation of metastatic tumor models and treatment schedule. LLC tumor-bearing mice, following LLC cell inoculation, were administered, intravenously, TFG (10 nmol/kg), TFMG (10 nmol/kg), or vehicle control (PBS) on days 7, 10, and 13, and the primary tumors were dissected on day 14. Inguinal lymph nodes (LNs) and lungs were sampled on day 28. b Representative photographic images of metastatic lungs resected from mice from the control, TFG, or TFMG groups. Graphical representation of the observed metastatic nodules in each group (n ≥ 8). c Confocal images of sections of inguinal LNs showing cytokeratin+ tumor metastatic areas. Sections of inguinal LNs from vehicle control (PBS), TFG, or TFMG-treated mice were stained with cytokeratin (green, epithelial cells), LYVE-1 (yellow, lymphatic vessels), and Hoechst 33258 (blue, nuclei) (n = 5). Scale bars: 100 μm. Quantitation (c) was done using ImageJ software. d Schematic diagram depicting the treatment schedule for MMTV-PyMT mice. Tumor growth was analyzed weekly in the MMTV-PyMT transgenic mouse models from week 12 and onwards following birth. The mice were treated with TFG (10 nmol/kg), TFMG (10 nmol/kg), or vehicle control (PBS) every 3 days until the tumors were sampled and analyzed at week 15. e Pattern of increase in tumor burden in the vehicle control (PBS), TFG-, or TFMG-treated MMTV-PyMT mice. Tumor burden was calculated as the sum of the volumes of all tumor masses (n = 4). f Pattern of increase in the number of palpable tumor nodules in the MMTV-PyMT mice (n = 4). g Photographic images of representative metastatic lungs resected from the MMTV-PyMT mice at week 15. The yellow arrowheads indicate metastatic nodules in the lungs of the respective groups (n = 4). Data are presented as the mean ± SD. Data information: Data are presented as the mean ± SD. Statistical analysis was done using two-way ANOVA for growth curves or a student t test for No. of metastatic nodules. *P < 0.05 (b, c), *P < 0.0001 (e, f), *P < 0.001 (g).

