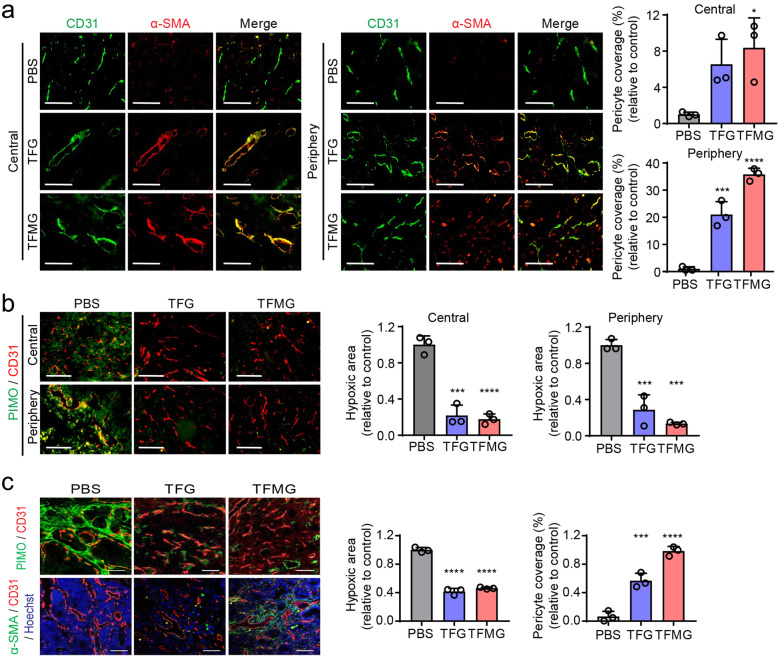
Fig. 3.
TFG and TFMG-induced tumor vascular normalization. a Confocal images of tumor sections showing α-SMA+ pericyte coverage on tumor vessels in the central and peripheral regions of allograft tumors from the LLC tumor model. Frozen tumor sections were stained with CD31 (green, blood vessels) and α-SMA (red, pericyte). Scale bars: 100 μm. Right graphs show the quantitation of fluorescent images by ImageJ software (n ≥ 3). b Confocal images of tumor sections showing hypoxic regions in the center and periphery of the LLC tumors stained with Hypoxicprobe™ (green, PIMO, hypoxic areas) and CD31 (red, blood vessels). Scale bars: 100 μm. Right graphs show the quantitation of fluorescent images by ImageJ software (n ≥ 3). c Confocal images of tumor sections showing hypoxic regions in the center of the tumor from the MMTV-PyMT mice stained with Hypoxicprobe™ (green, PIMO, hypoxic areas) and CD31 (red, blood vessels). Confocal images of tumor sections showing α-SMA+ pericyte coverage on tumor vessels. Frozen tumor sections were stained with α-SMA (green, pericyte), CD31 (red, blood vessels), and Hoechst 33258 (blue). Scale bars: 100 μm (n = 3). The quantitation in (a–c) were conducted using ImageJ software. Data information: Data are presented as the mean ± SD. Significant enrichment: *P < 0.05; ***P < 0.001; ****P < 0.0001 (Sidak’s multiple comparisons test)

