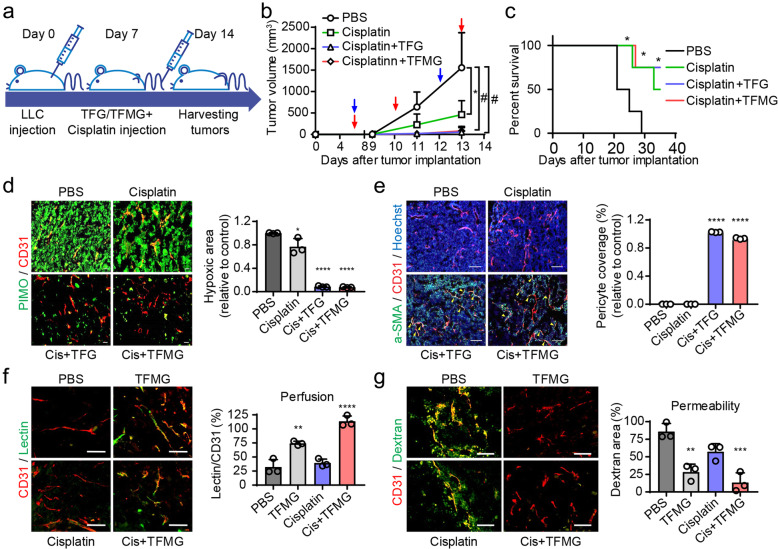
Fig. 7.
TFG and TFMG enhance the chemotherapeutic efficacy of cisplatin in LLC tumor-bearing mice. a Schematic diagram depicting the LLC allograft model development and treatment schedule. LLC tumor-bearing mice, following LLC cell inoculation, were administered intravenous injections of vehicle control (PBS) on days 7, 10, and 13, or cisplatin (3 mg/kg) on days 7 and 12, with or without TFG (10 nmol/kg) or TFMG (10 nmol/kg) on day 7s, 10, and 13. Tumors were harvested on day 14. b Tumor growth pattern in LLC tumor-bearing mice administered PBS, cisplatin, cisplatin and TFG, or cisplatin and TFMG. The red arrowheads represent the time points of TFG/TFMG administration, while the blue arrowheads represent the time points of cisplatin administration. Tumor volumes in each group at days 7, 9, 11, and 13 were calculated (n = 8). *P < 0.001; #P < 0.0001 vs. PBS control. c Survival curves of LLC tumor-bearing mice. d Confocal images of tumor sections showing hypoxic regions in the center of the LLC tumors stained with Hypoxicprobe™ (green, PIMO, hypoxic areas) and CD31 (red, blood vessels) (n = 4). Scale bars: 100 μm. e Confocal images of tumor sections showing α-SMA+ pericyte coverage on tumor vessels. Frozen tumor sections were stained with α-SMA (green, pericyte), CD31 (red, blood vessels), and Hoechst 33258 (blue) (n = 4). Scale bars: 100 μm. f Mice bearing LLC tumor grafts were intravenously injected with (100 nmol/mouse) TFMG or PBS every other day three times. On the second day after the last injection, the tumor grafts were removed and sectioned (10 μm) while frozen. The endothelium was visualized using an antibody against CD31. After treatment, the mice were intravenously injected with 100 μg of Dylight488-lectin. Approximately 30 min later, tumor grafts were collected (n = 4). g To measure the permeability of tumor blood vessels after treatment, mice were intravenously injected with 2.5 mg FITC-dextran followed by 30 min of circulation. The tumor grafts were removed after heart perfusion (n = 3). The quantitations in (d–g) were conducted using ImageJ software. Data information: Data are presented as the mean ± SD. Significant enrichment: *P < 0.05; **P < 0.01; ***P < 0.001; ****P < 0.0001 (c–g) (two-way ANOVA in (b); Mantel-Cox test in (c); and Sidak’s multiple comparisons test)

